
Are you looking to flex your Excel VBA muscles?
Well, you’ve come to the right place! In this quick tutorial, you will learn how to change the position and size of Excel charts right in the VBA editor.
Sample Data
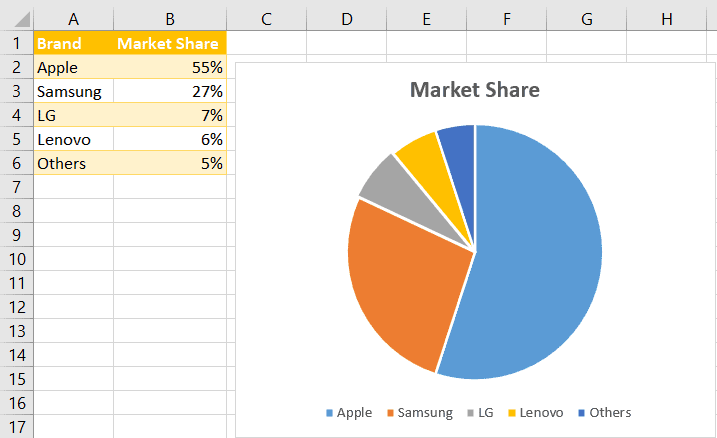
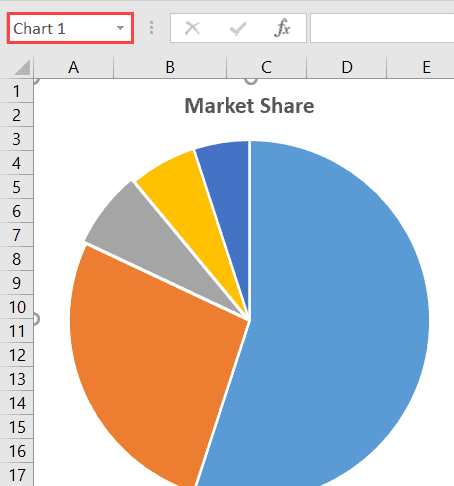
In order to show you the tricks of the trade, here’s a simple Excel pie chart that we will use as a running example:
Without beating around the bush, let’s get down to business.
Prepare the VBA Editor
For those who have never worked in VBA, here’s how to access the almighty VBA editor.
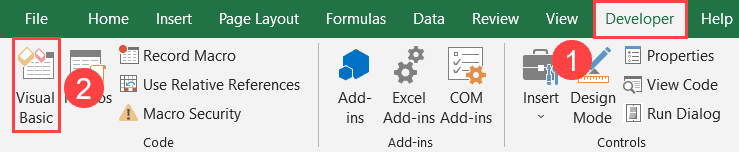
1. Navigate to the Developer tab.
2. In the Code group, hit the “Visual Basic” button.
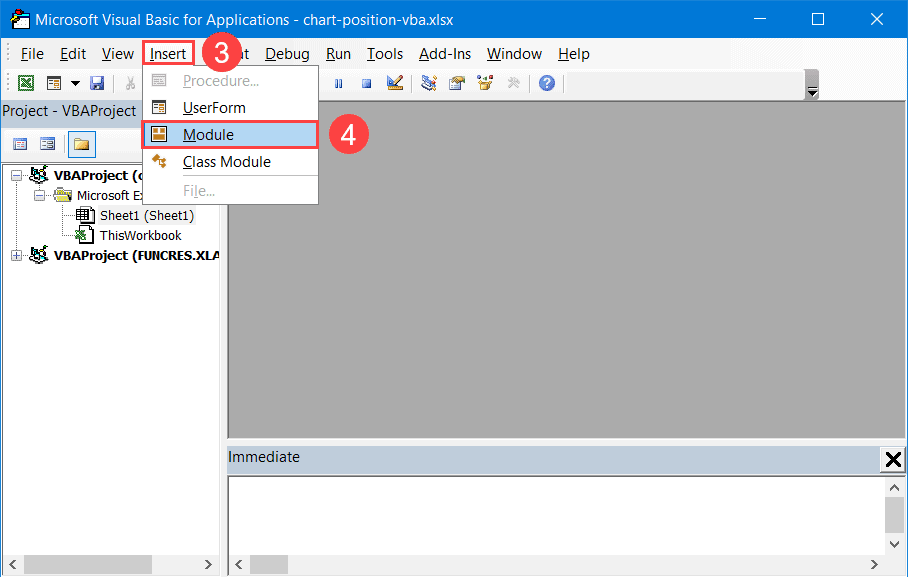
3. In the VBA editor, click the Insert tab.
4. Click “Module” to create a new module.
How to Change the Position of a Chart in VBA
First things first, let me show you how to adjust the position of your chart in VBA.
Once you have created a new module, copy the following code into the VBA editor, click “Run Sub/UserForm” to modify the chart’s position:
Sub Change_Chart_Position()
With ActiveSheet.Shapes("Chart 1")
    .Left = Range("D5").Left
    .Top = Range("D5").Top
End With
End Sub
Let’s break down the code shown above in greater detail.
1. With ActiveSheet.Shapes(“Chart 1”) – This line of VBA code selects a chart (“Chart 1”) within the active worksheet (ActiveSheet).
But how do you figure out the name of your chart?
To do that, select the chart you want to reposition. Then, to the left of the Formula bar, you can see the name of your chart in the Name Box.
2. .Left = Range(“D5”).Left and .Top = Range(“D5”).Top – The cell references within the Range objects (“D5”) specify the top-left corner of your chart. So, all you need to do is to change “D5” to any worksheet cell where you want your chart to be placed.
How to Resize a Chart in VBA
Next stop: changing the size of our chart in VBA. Just add the following two lines of VBA code to get the job done:
Sub Change_Chart_Position()
With ActiveSheet.Shapes("Chart 1")
    .Left = Range("A1").Left
    .Top = Range("A1").Top
    .Height = Range("A1:A20").Height
    .Width = Range("A1:E1").Width
End With
End Sub
Here’s the breakdown of the code we added to help you adjust.
- .Height = Range(“A1:A20”).Height – This line of code sets the height of your graph using worksheet cells as a measuring tool. In this example, the chart height equals the distance from cell D5 to cell D25.
- .Width = Range(“A1:E1”).Width – This determines the width of your chart. As for the pie chart we used as a running example, this line of VBA code sets the width to be the distance from cell A1 to cell E1.
