To delete a chart in Google Sheets, select the chart you need to delete, click on the three dots menu, and choose Delete chart.
Have you ever needed to delete an unwanted item while working on a Google Sheets document? Most likely!
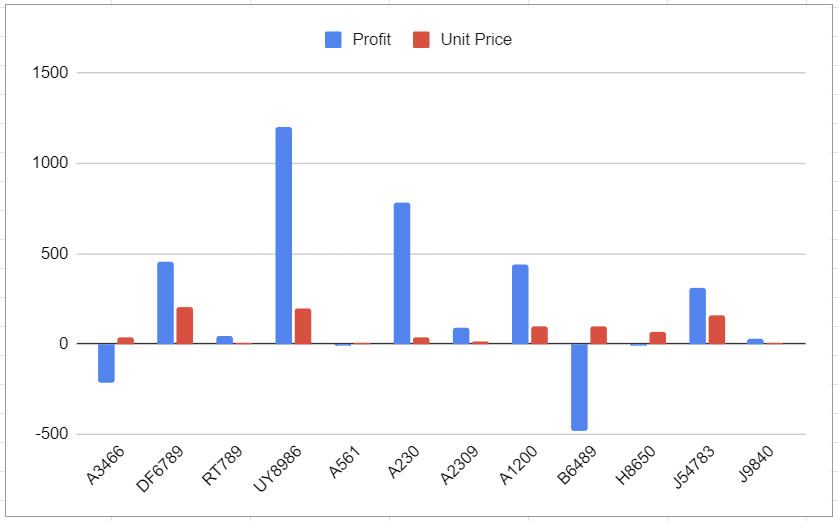
In spite of the fact that charts and graphs can be very useful tools when presenting your data in any number of ways, there are times when you may want to clear your spreadsheet of unneeded charts.
The process of removing an unnecessary chart from Google Sheets is very simple and can be accomplished in just a few seconds.
In this article, you will learn how to do it quickly and easily by following the steps provided.
Text
How to Delete a Chart in 3 Steps
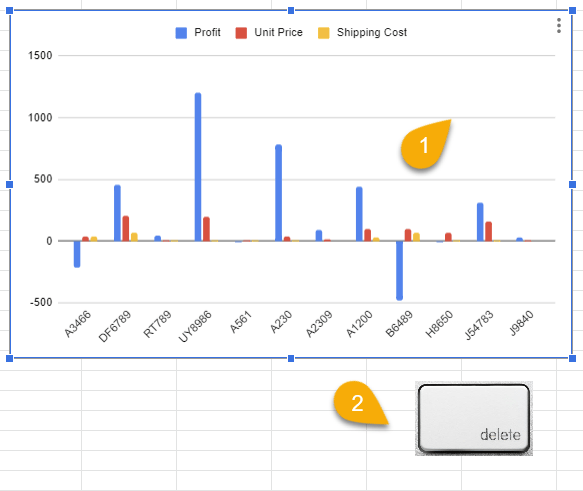
Step 1: First, click on the chart you need to remove from the spreadsheet.
Step 2: Next, press the three dots menu at the top right-hand corner of the chart.
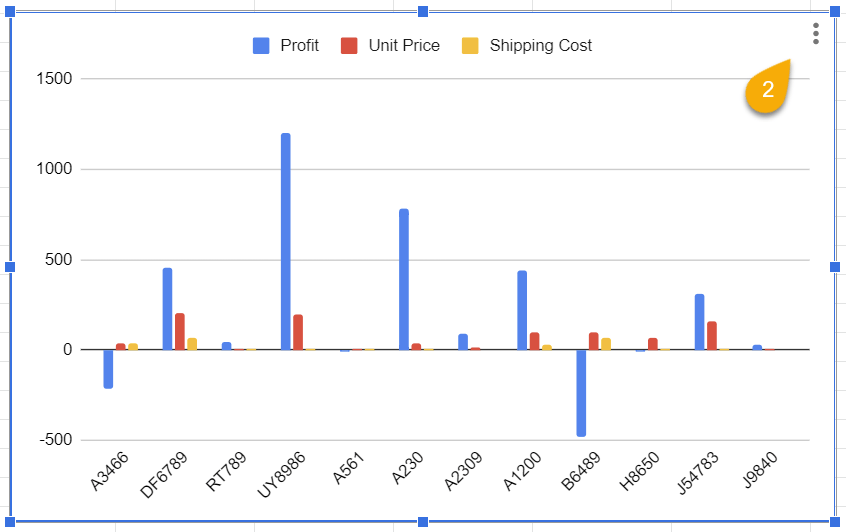
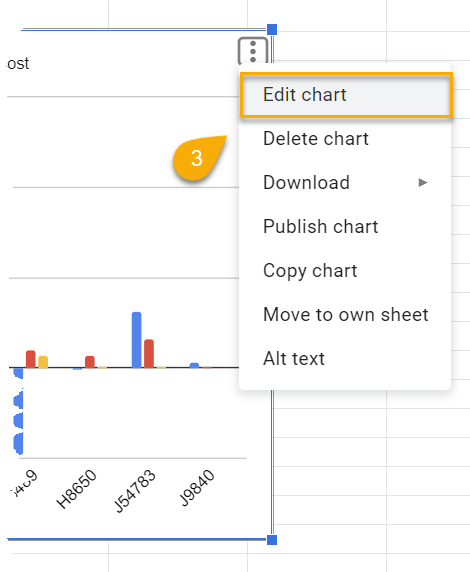
Step 3: Finally, choose the Delete chart option from the list. Just like that, your chart will be deleted from the spreadsheet.
Note: As an alternate method, you can use the keyboard to delete the chart as well.
To do this, simply select the chart you want to get rid of and press the Delete button on the keyboard.
Bonus: How to Delete Data in a Chart
If your chart contains a large amount of data and you want to remove certain indicators from the chart without deleting the whole chart, you can do it quite easily.
Check out the step-by-step process below to learn how.
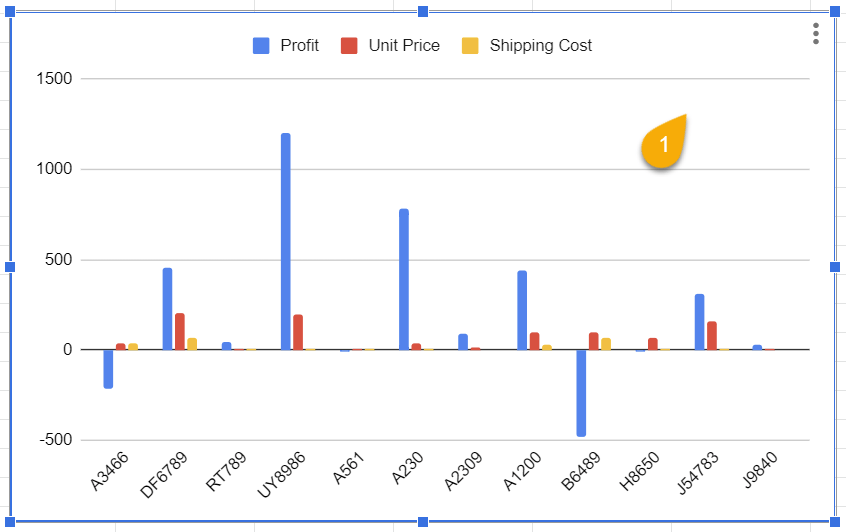
Step 1: The first thing you need to do is click on the chart you would like to edit.
Step 2: Next, select the three-dot menu at the top right-hand corner of the chart to access the list of options.
Step 3: Click on the Edit chart option, and you will be taken to the Chart editor task pane.
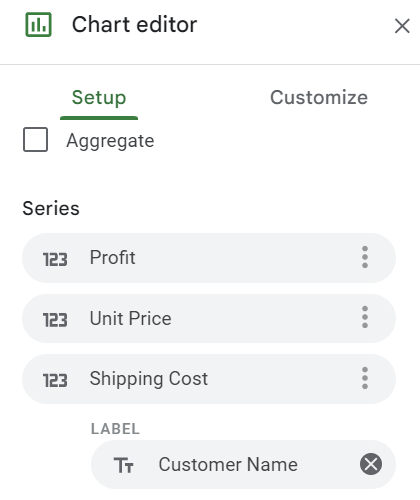
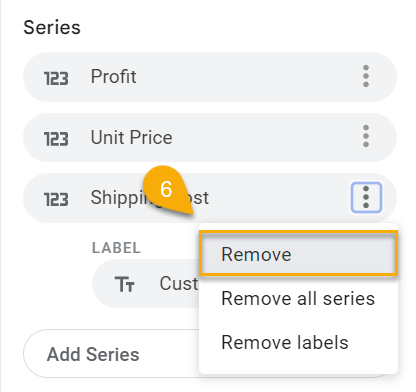
Step 4: From here, go to the Series section in the Chart editor menu.
Step 5: Select the data you want to remove and press the three dots menu beside it.
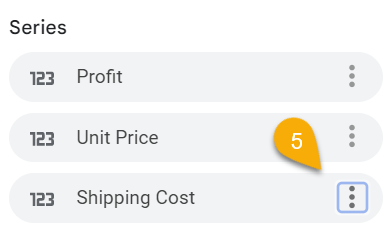
Step 6: Finally, tap on the Remove option to delete the data that you don’t need in the chart.
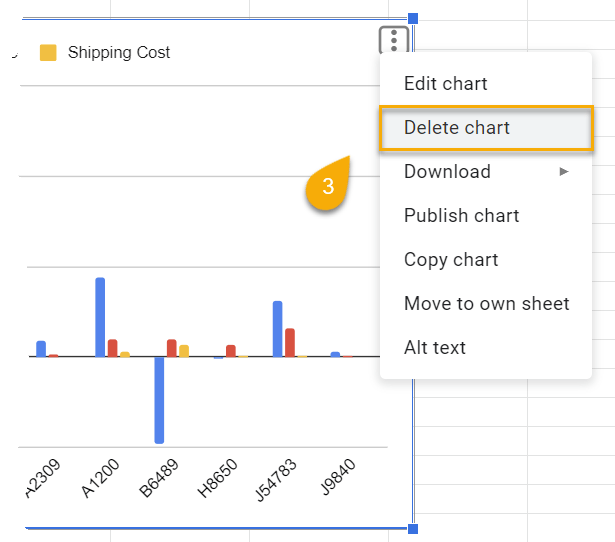
Now your chart will be updated accordingly, and you will be able to work with it in any way you like.
Check out the sample below to see how the updated version looks: