
A scatter plot is a graph that shows the relationship between two variables. The variables are each plotted on a graph, and the relationship between the two is indicated by how close the points are to each other.
Scatter plots are a common way to visually represent data. There are many different scatter plot makers available, so finding the best one for your needs can be tricky.
In this article, we will look at seven of the best scatter plot makers based on their pricing, features, and user ratings. Read on to see which scatter plot maker is right for your company.
What Are the Best Scatter Plot Makers in 2023?
If you were to look on the market for scatter plot makers, you would find that there are many options available. With so many options, it can be hard to decide which one is best for you. Here are the top seven scatter plot makers we found in our research:
- Plotly
- Visme
- Canva
- Wepick
- ZingChart
- FusionCharts
- RStudio
- Google Charts
1. Plotly
Best for IT companies

Plotly is a cloud-based graphing and analytics platform. It is used by IT companies to make interactive, publication-quality graphs.
Plotly also has a free trial, so you can test it out before purchasing a premium subscription.
Personally, I like that Plotly is easy to use. You don’t need any coding skills to create a graph. Simply upload your data, select your graph type, and customize the look of your graph to fit your specifications.
Top Features
- Monthly updating: Plotly has a ton of free material on its website: code, testing tools, and downloads for graphing and application-building libraries.
- Intelligent formatting: Customize charts with colors, fonts, and other styling options.
- Online sharing: Share charts and graphs online or embed them in websites or apps.
Pros
- Easy-to-use interface
- Create custom visuals, add annotations, and even export your data to Excel
- Free trial available
Cons
- Can be slow to load, especially with a lot of data
- Free version is fairly limited in terms of features
Pricing
Plotly offers a free plan and three paid plans:
- Free plan: This plan includes 500 MB of storage and 20,000 points per graph. However, with the free plan, you are limited to 10 private graphs and 3 public graphs.
- Basic ($9/mo per user): This plan includes 1GB of data storage and 20,000 points per graph.
- Professional ($19/mo per user): The Professional plan includes 10GB of data storage and 100,000 points per graph.
- Enterprise ($99/mo per user): The Enterprise plan gives you unlimited data storage and 1 million points per graph.
Why we recommend this tool: If you’re looking for a powerful and easy-to-use scatter plot maker, Plotly is a great option. With Plotly, you can create beautiful scatter plots in just a few clicks.
2. Visme
Best for individuals and small businesses
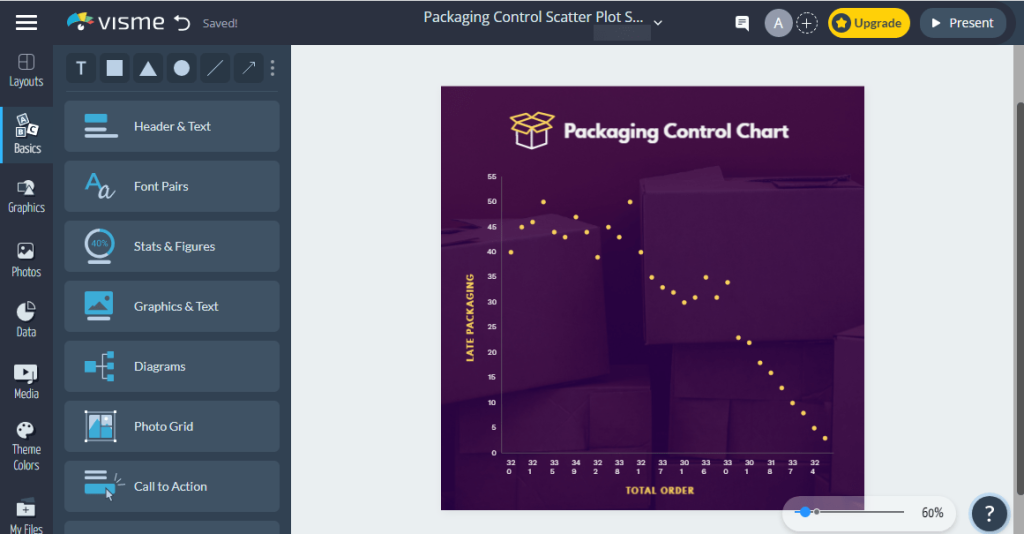
Visme is a great scatter plot maker for individuals and small businesses. With Visme, you can create scatter plots without any prior design experience.
What I like best about Visme is that it’s very user-friendly. You can create a professional-looking scatter plot in minutes.
Top Features
- Drag-and-drop functionality: Simply drag and drop your tools to construct a scatter plot.
- Powerful downloading: Download as many scatter plots as you like, in a variety of file types, and post them online.
- Free templates: Make your data more appealing with a free collection of chart templates. Choose from a variety of professionally-designed templates to get started.
- Customizable: Personalize your scatter plots with photos or illustrations in order to match your company’s image or personality.
Pros
- Very user-friendly and easy to use
- Wide selection of free, professionally designed templates
- Customize your scatter plots to match your brand or style
Cons
- Some features are only available in the paid version
- Most templates are general, without customization, and need editing
Pricing
Visme offers a free plan and three paid options:
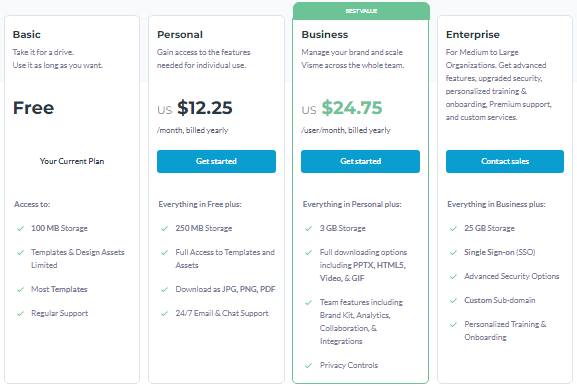
- Basic (Free): This gives you access to 100 MB storage, most templates, regular support, and basic features.
- Personal ($12.25/mo per user): The Personal plan includes all the features of the Basic plan plus unlimited projects and premium features, such as 24/7 support.
- Business ($24.75/mo per user): The Business plan includes all features of the previous plans plus unlimited projects and advanced features like custom branding and export options.
- Enterprise (need to contact for a quote): This plan offers Single Sign-on (SSO), 25 GB storage, and advanced security options.
Why we recommend this tool: Visme is ideal for individuals and small companies due to its simplicity. It allows you to quickly generate free stunning scatter plots without any prior graphic design experience.
3. Canva
Best for social media
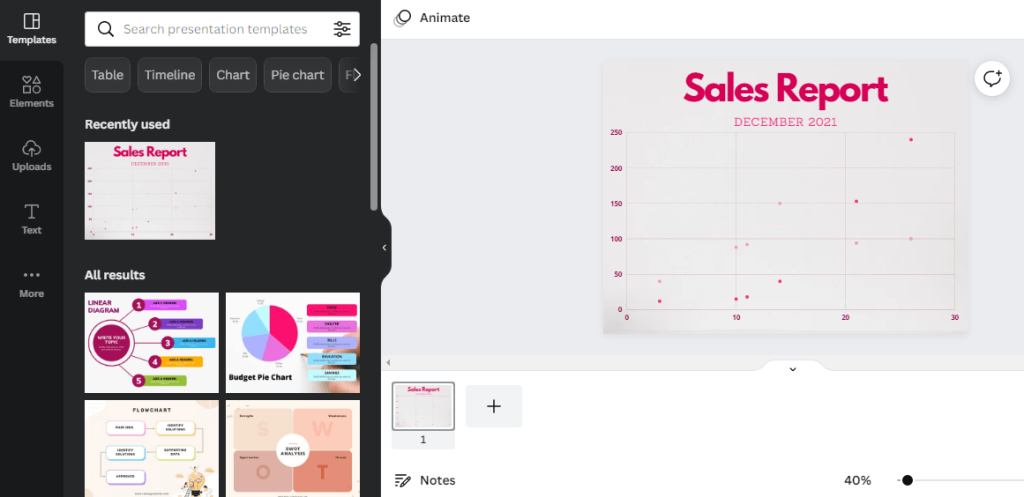
Canva is best known as a design tool. However, it also has a great selection of templates for scatter plots.
With Canva, you can create beautiful scatter plots for your social media accounts and share them with others or download them for offline use.
I like that Canva doesn’t require any technical knowledge to get started and has a very simple interface.
Top Features
- User-friendly interface: Canva’s interface is designed to be intuitive and easy to use.
- 20+ professional templates: Canva has a great selection of templates for scatter plots.
- Offline use: Download your scatter plot for offline use.
- Real-time sharing: Scatter plots may be quickly disseminated via social media or email.
Pros
- Quickly upload charts to social media platforms
- Easily create scatter plots using the intuitive interface
- Free to use
Cons
- Best known as a design tool, so may not have all the features needed for data visualization
- Tough to blend themes of varying dimensions
Pricing
Canva is free to use. There are no paid plans available.
Why we recommend this tool: Canva is a great option if you’re looking for a free scatter plot maker. This is a fantastic choice for getting around social media.
4. Wepik
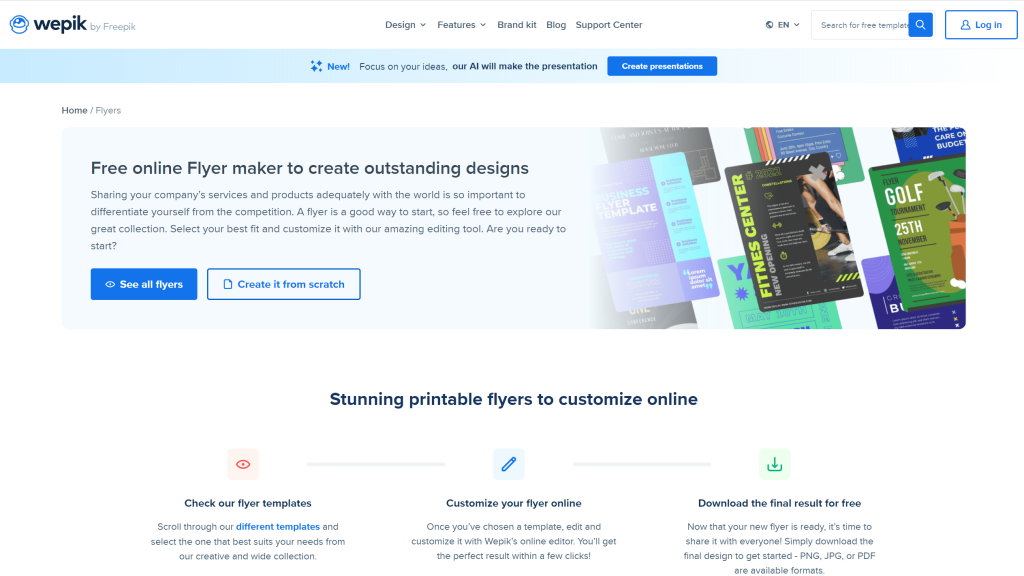
Wepik is a great tool for creating professional-looking scatter plots. It comes with an array of features and tools, making it easy to customize your scatter plot.
Wepik also offers an extensive selection of eye-catching flyer templates to customize, which makes it easy to create stunning scatter plots.
Top Features
- User-friendly interface: Wepik’s interface is designed for convenience and ease of use.
- 30+ professional templates: Wepik has a wide selection of templates for scatter plots.
- Data import: Wepik allows data to be imported from a variety of sources.
- Customizable design: Design your scatter plot with custom colors, fonts, and shapes.
Pros
- Easy to use
- Wide selection of templates
- Ability to customize designs
Cons
- Somewhat limited selection of templates
- Data import can be a bit tricky
Pricing
- Wepik offers a free version that allows you to use the basic features. The paid version costs $14.99/month and unlocks more features.
Why we recommend this tool: Wepik is a great choice if you’re looking for a scatter plot maker that can create professional-looking scatter plots. It’s easy to use and has an extensive selection of templates.
5. ZingChart
Best for small businesses
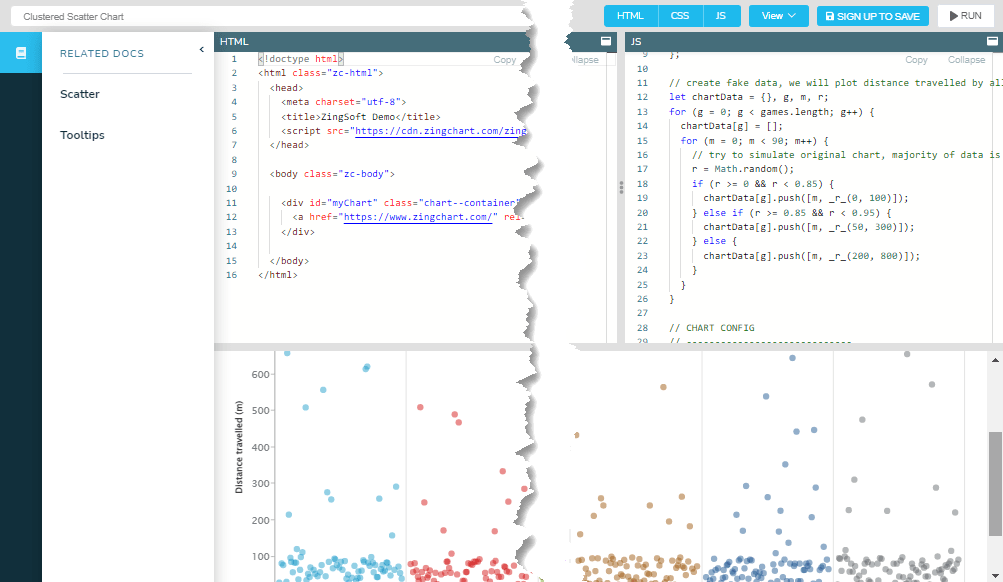
ZingChart is a cloud-based graphing and analytics platform. It’s ideal for small companies that need to quickly and simply present their data.
This program offers a variety of features that make it an excellent choice for those who need to understand their data at a glance.
Personally, I like that ZingChart has a wide range of functions. It helps you easily manage your business and modify your charts in just a few clicks.
Top Features
- 200+ types of scales: Choose from a range of charts to find the one that works for you.
- Tooltips: Tips on figures and value boxes offer better orientation among your scatter charts.
- Automations: ZingChart is easy to use and provides a variety of options for customization, including the export format function and zoom for scatter plots.
- Customizable: Select the distinct elements of your graph to reflect your business.
Pros
- Helpful tooltips and automation features, especially for beginners
- Reasonably priced, particularly for the features it offers
- Free trial period
Cons
- All charts in the free edition have a watermark
- Closed source, meaning it will not be available for open-source usage
Pricing
ZingChart contains four paid plans:
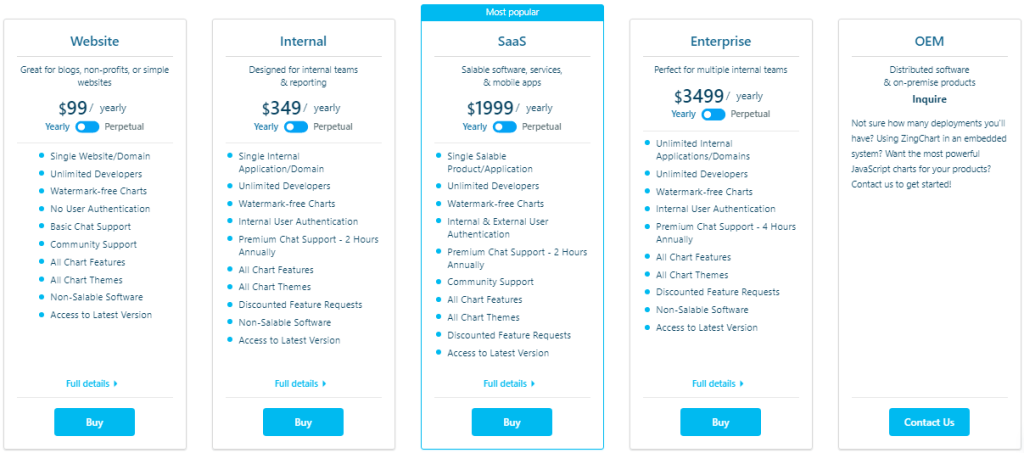
- Website ($99/year): The Website plan is perfect for small businesses and includes watermark-free charts, different chart themes, community support, and unlimited developers.
- Internal ($349/year): This plan has all the features of the Website plan plus discounted feature requests and premium chart support (2 hours annually).
- SaaS ($1999/year): The SaaS plan includes the options of the previous plan plus internal and external user authentication.
- Enterprise ($3499/year): This plan offers premium chat support (4 hours annually) on top of all the rest.
Why we recommend this tool: ZingChart is an excellent choice for small organizations. It’s also simple to use and comes with a lot of customization choices.
6. FusionCharts
Perfect for company executives
FusionCharts is a JavaScript charting library that enables you to create interactive charts and scatter plots. It also works with your web applications. It’s perfect for medium to large businesses that need to visualize data in an impactful way.
Personally, I like the wide range of customization options available with FusionCharts. You can really make your scatter plots stand out with this tool.
Top Features
- 140+ chart types: Create the perfect chart for your needs from a huge selection of choices.
- Customizable: Design high-performance charts for huge data volumes.
- Works with any framework: Use FusionCharts with Angular, React, Vue.js, or any other framework.
Pros
- Provides a plethora of configuration options
- Works with any framework, making it very versatile
- Regularly updated library with new features
- Rich range of scatter plots
Cons
- Can be difficult for beginners
- A bit pricey compared to some of the other options on this list
Pricing
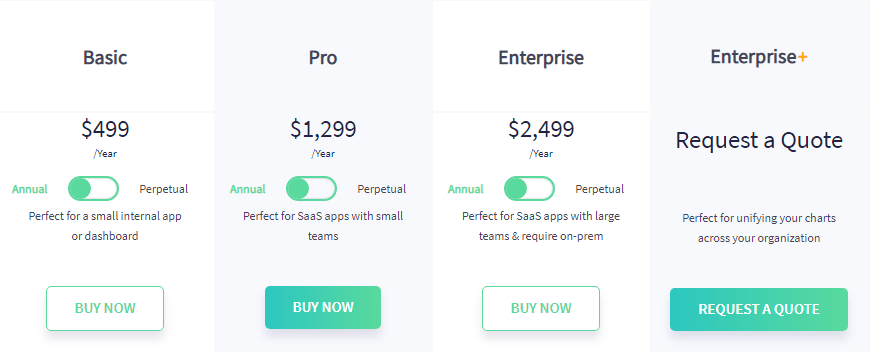
- Basic ($499/year): The Basic plan includes all 140+ chart types, 18 export formats, and free technical support.
- Pro ($1299/year): This plan contains all the features of the Basic plan plus the full source code.
- Enterprise ($2499/year): The Enterprise plan includes all the features of the previous plan plus advanced features like an unlimited number of products, 24/7 technical support, and more.
- Enterprise+ (need to contact for a quote).
Why we recommend this tool: FusionCharts is a great choice for businesses. It offers a wide range of features and customization options. However, it can be difficult to use for beginners.
7. RStudio
Best for teams
RStudio is a best-in-class tool for creating statistical graphics, from simple plots to complex web applications. RStudio makes it easy to create interactive plots that can be shared with others.
With RStudio, you can create customizable scatter plots with multiple variables. You can also add regression lines, fit curves, and more.
Personally, I like the RStudio’s understandable interface. It’s very user-friendly, which makes it easy to create complex plots.
Top Features
- Powerful sharing: Easily share plots with others via the web or email.
- Model deployment: Create custom scatter plots with multiple variables.
- Automations: Add regression lines to your scatter plots to show relationships between variables and fit curves to your data to visualize trends.
Pros
- Very comprehensive and feature-rich
- Easy to add regression lines, fit curves, and more
- Free and open source
- Great technical support
Cons
- Can be slow when working with large data sets
- Only the desktop version will get better support
- Can be difficult to use for beginners
Pricing
RStudio is free and open source.
Why we recommend this tool: RStudio is a great choice for teams who need to create complex statistical graphics. If you’re looking for a comprehensive, feature-rich scatter plot maker, RStudio is a great option.
8. Google Charts
Best for marketing teams
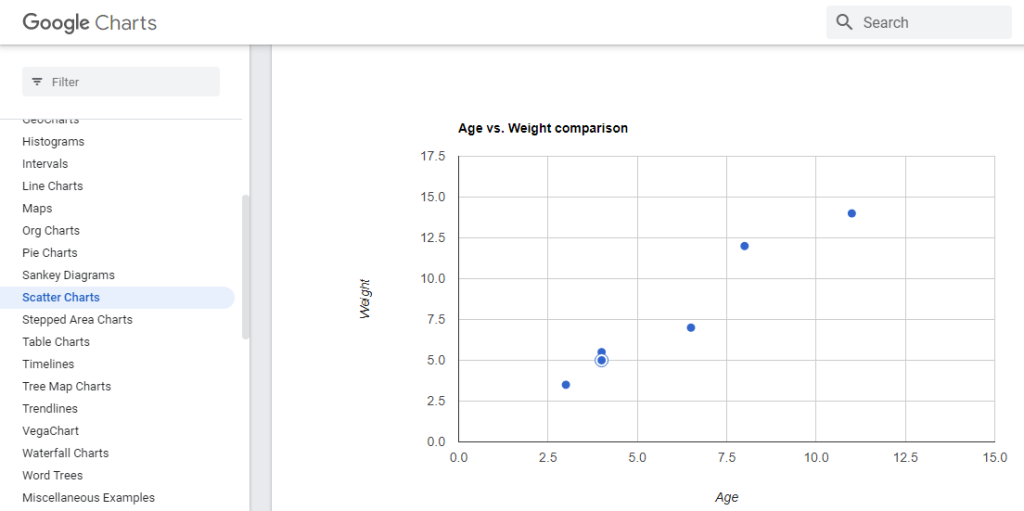
Google Charts is a powerful tool that lets you create interactive charts and graphs. It’s perfect for marketing teams who want to visualize data and share it online with others.
Additionally, the Google Charts tool is available for free. There are no premium services available.
Personally, I like that Google Charts is easy and free to use. You can work without a high cost.
Top Features
- Rich gallery of chart types: Choose from among a number of different types of scatter plots.
- Controls and dashboards: Modify the interactive dashboard with additional options.
- Intuitive design: The user interface is simple to use and does not require any technical knowledge.
- Customizable: Create the appearance of charts yourself.
- Shareable in real time: Create shareable charts for your company or personal portfolio online, adding them to websites or apps as well.
Pros
- Free to use—no paid plans available
- Create and share scatter plots easily
- No learning curve—get started right away
Cons
- Not able to work offline
Pricing
The Google Charts tool is completely free.
Why we recommend this tool: If you’re looking for a free scatter plot maker, Google Charts is a great option. With Google Charts, you can make impactful scatter plots easily.
What Are the Benefits of Using Scatter Plot Software?
Scatter plots are excellent tools to help you better understand your data, as they readily show the relationship between variables.
The visual representation of a scatter plot makes it easier to comprehend what your data represents. It is a valuable option for marketing, IT, social media purposes, and more.
5 Things You Need to Look For in Scatter Plot Software
Choosing the best scatter plot software can be a daunting task. But if you keep these five things in mind, you’ll be well on your way to finding the perfect solution for your needs.
- Ease of use – The best scatter plot software is easy to use and doesn’t require any prior knowledge or experience to get started. It should have a user-friendly interface that is intuitive and straightforward.
- Customization options – Look for scatter plot software that allows you to customize the appearance of your scatter plot. This includes options for changing the colors, font size, and more.
- Ability to export and share – The best scatter plot software will allow you to export your scatter plot in a variety of formats (JPEG, PNG, PDF, etc.) so you can share it with others without any trouble. It should also have options for sharing online (via email, social media, etc.).
- Pricing – Scatter plot software can range in price from free to hundreds of dollars. It’s important to find something that fits within your budget. Keep in mind that you usually get what you pay for, so don’t be afraid to invest in a quality product.
- Customer support – When you’re looking for scatter plot software, find a company that offers quality customer support. This way, if you have any questions or problems, you can rest assured that someone will be there to help you out.
The Wrap Up
For businesses that require effective management of their data, scatter plots provide a great way to visually represent that data, clearly showing the connections between variables.
There are numerous different scatter plot generators on the market, so selecting the best one for your needs may require some research. Keep these five things in mind when you’re looking for scatter plot software, and you’ll be sure to find the perfect solution for your needs.
