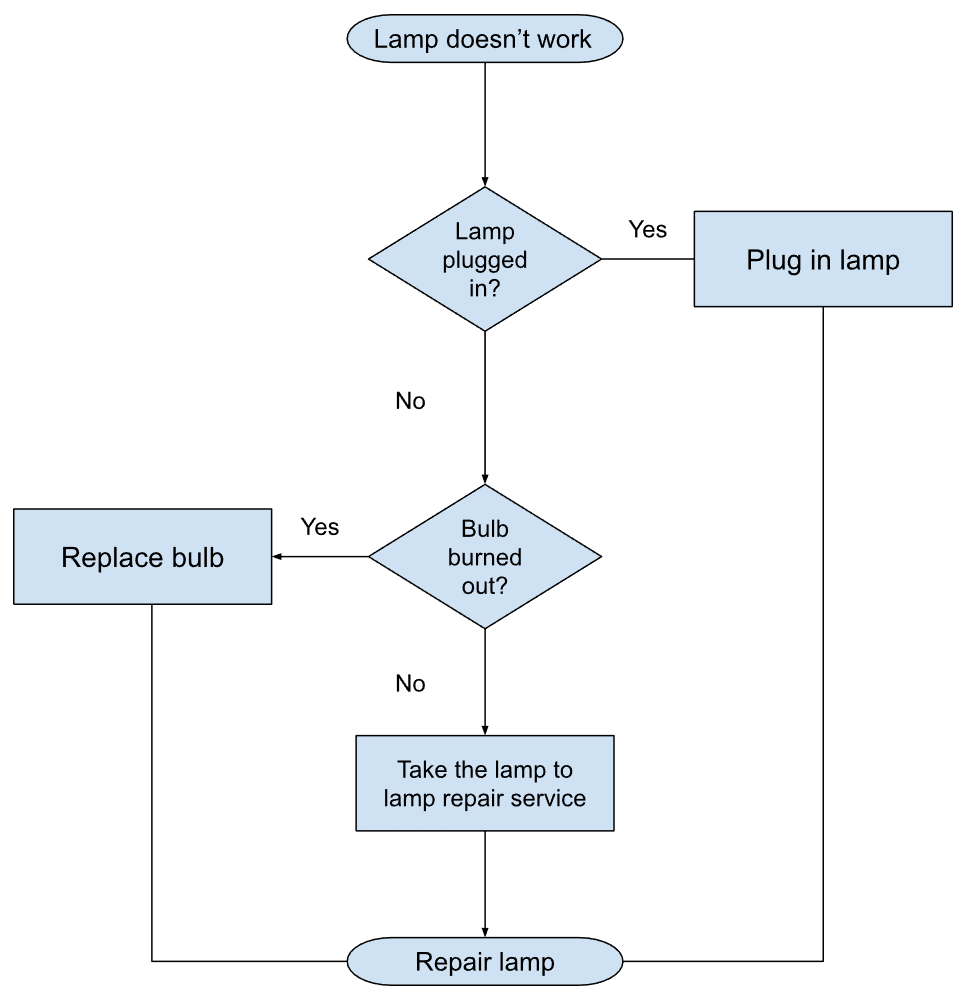
To make a flowchart in Google Sheets, go to the Insert tab, open the Drawing window, and build your process flowchart using built-in symbols, shapes, and connectors.
A flowchart is a graph that’s widely used to illustrate the components of a certain process or system and how they relate to each other to perform a certain task.
Flowcharts are popular across all major industries, from marketing and HR to finance and manufacturing.
Since it’s a data visualization technique that’s truly ubiquitous, Google Sheets offers a wide range of shapes and connectors that allow you to create custom process flowcharts.
And in this article, we’ll cover how to create a flowchart in Google Sheets.
Quick Jump
ToggleHow to Create a Flowchart (Step-by-Step)
Essentially, the way you build a flowchart in Google Sheets is by creating a drawing using special flowchart shapes, which are part of the default data visualization tool set.
Follow these steps to make a flowchart in Google Sheets.
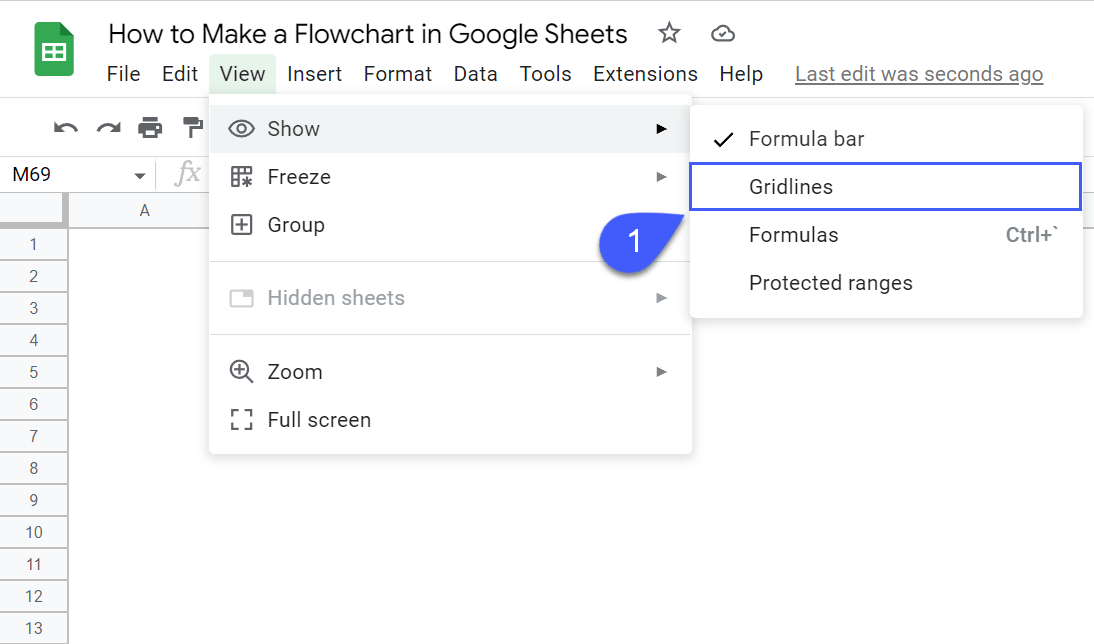
Step 1: Open a blank Google Sheets document. Additionally, you can remove gridlines to make your flowchart a bit more visually appealing (View > Show > Gridlines).
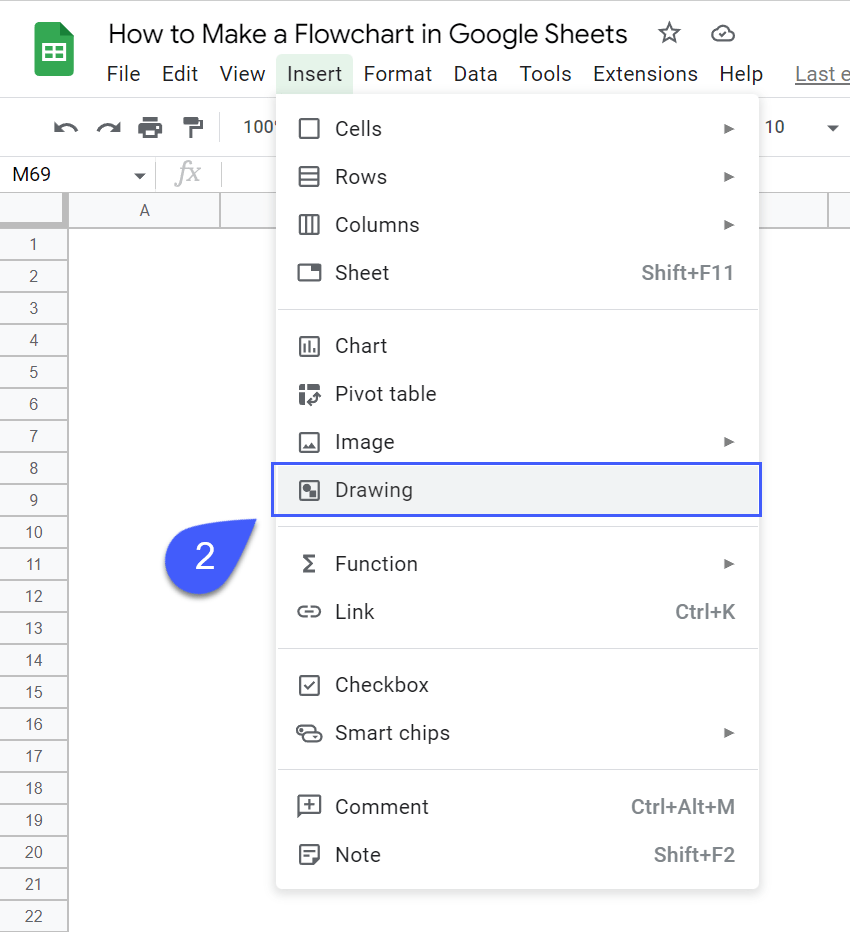
Step 2: Navigate to the Insert tab and choose “Drawing” from the drop-down menu that appears.
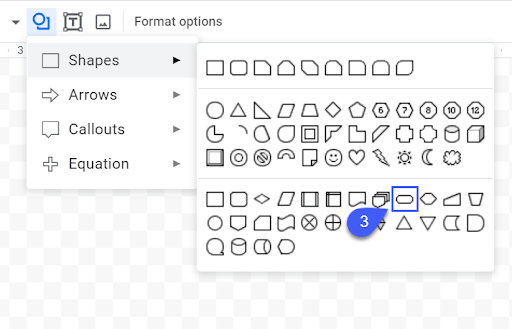
Step 3: Create the shapes defining the beginning and end of your process. In the Drawing window, go to Shape, select “Shapes” from the drop-down menu that pops up, and choose “Flowchart: Terminator” to create an oval.
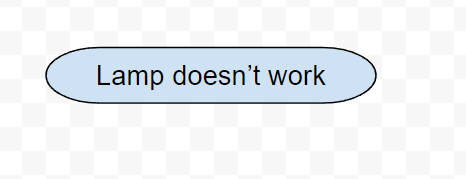
Draw the terminator flowchart shape anywhere in the drawing area, double-click on the shape you’ve just created, and name the shape in a way that characterizes the beginning of your process (in our case, it’s “Lamp doesn’t work”).
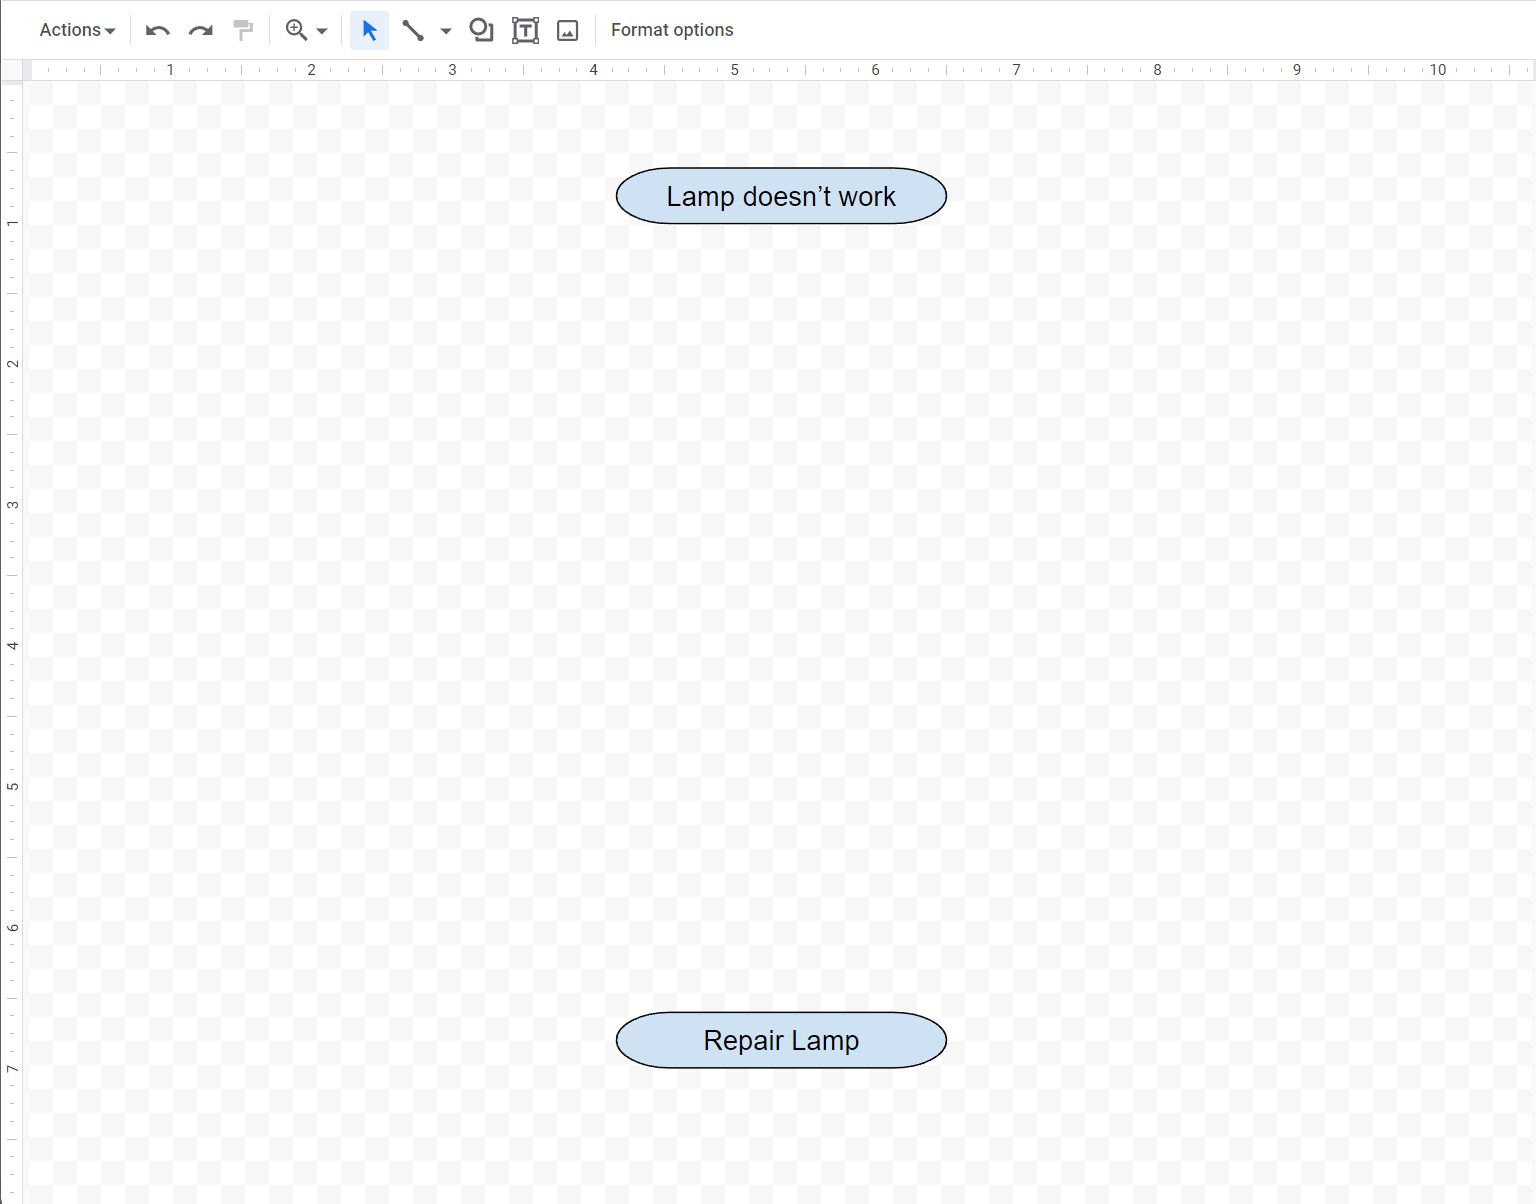
By following the same process, create another oval characterizing the end of your process and move it at the bottom of the drawing area.
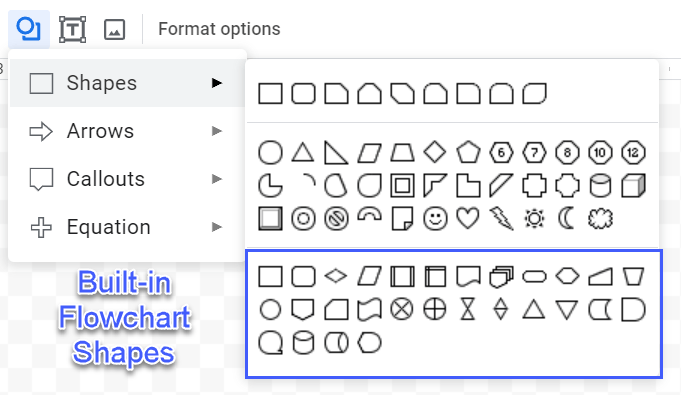
Step 4: Create the flow of your process using a wide range of built-in flowchart shapes and symbols (Shape > Shapes).
Here’s where you can find the selection of flowchart symbols available in Google Sheets (Jump to the next section where we cover each of them).
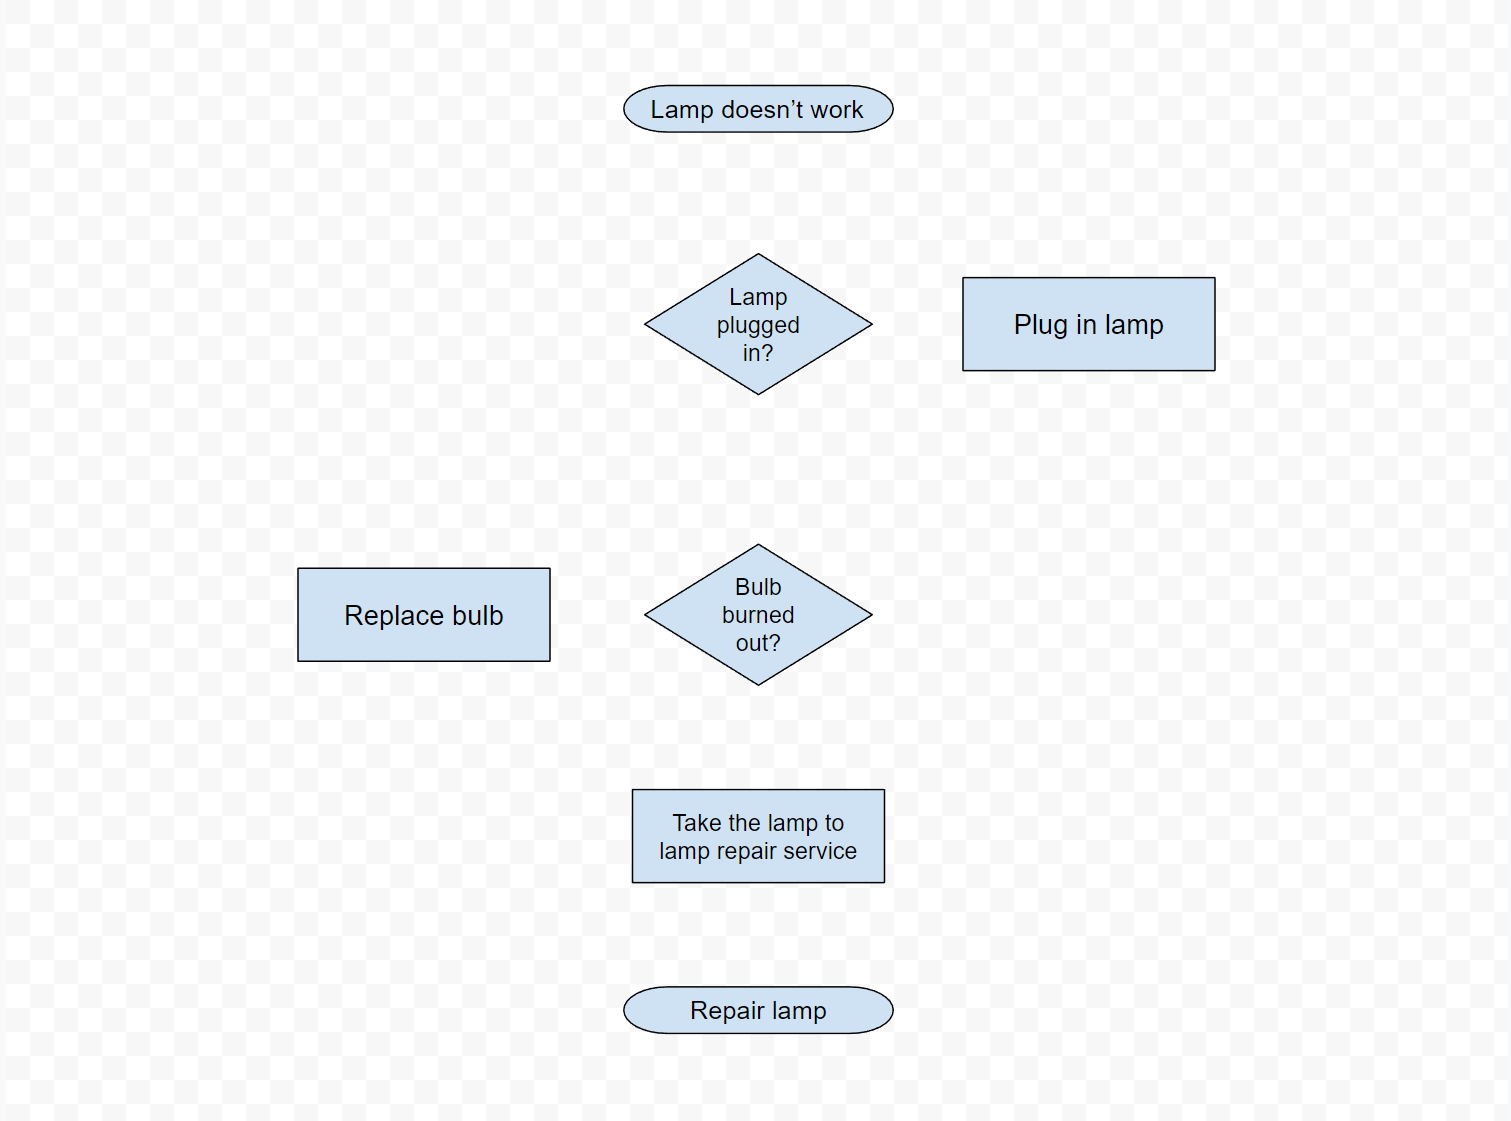
Here’s what our half-finished flowchart looks like at this point:
Step 5: Create the connectors for your flowchart to show how each step of the process relates to each other. In the Drawing window, hit the “Select line” icon, and choose either “Arrow” or “Elbow Connector” based on your needs.
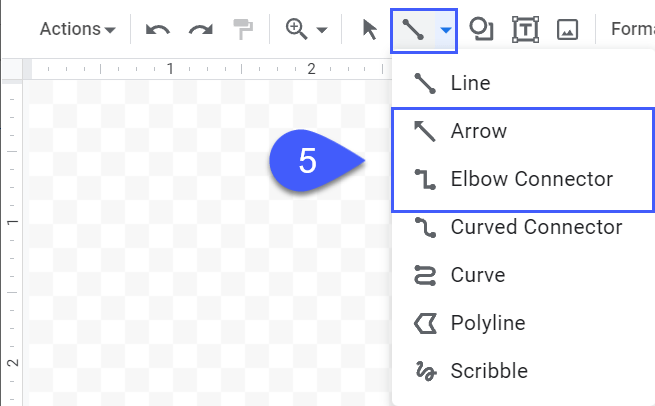
Using these two types of lines, create the connectors for your Google Sheets flowchart.
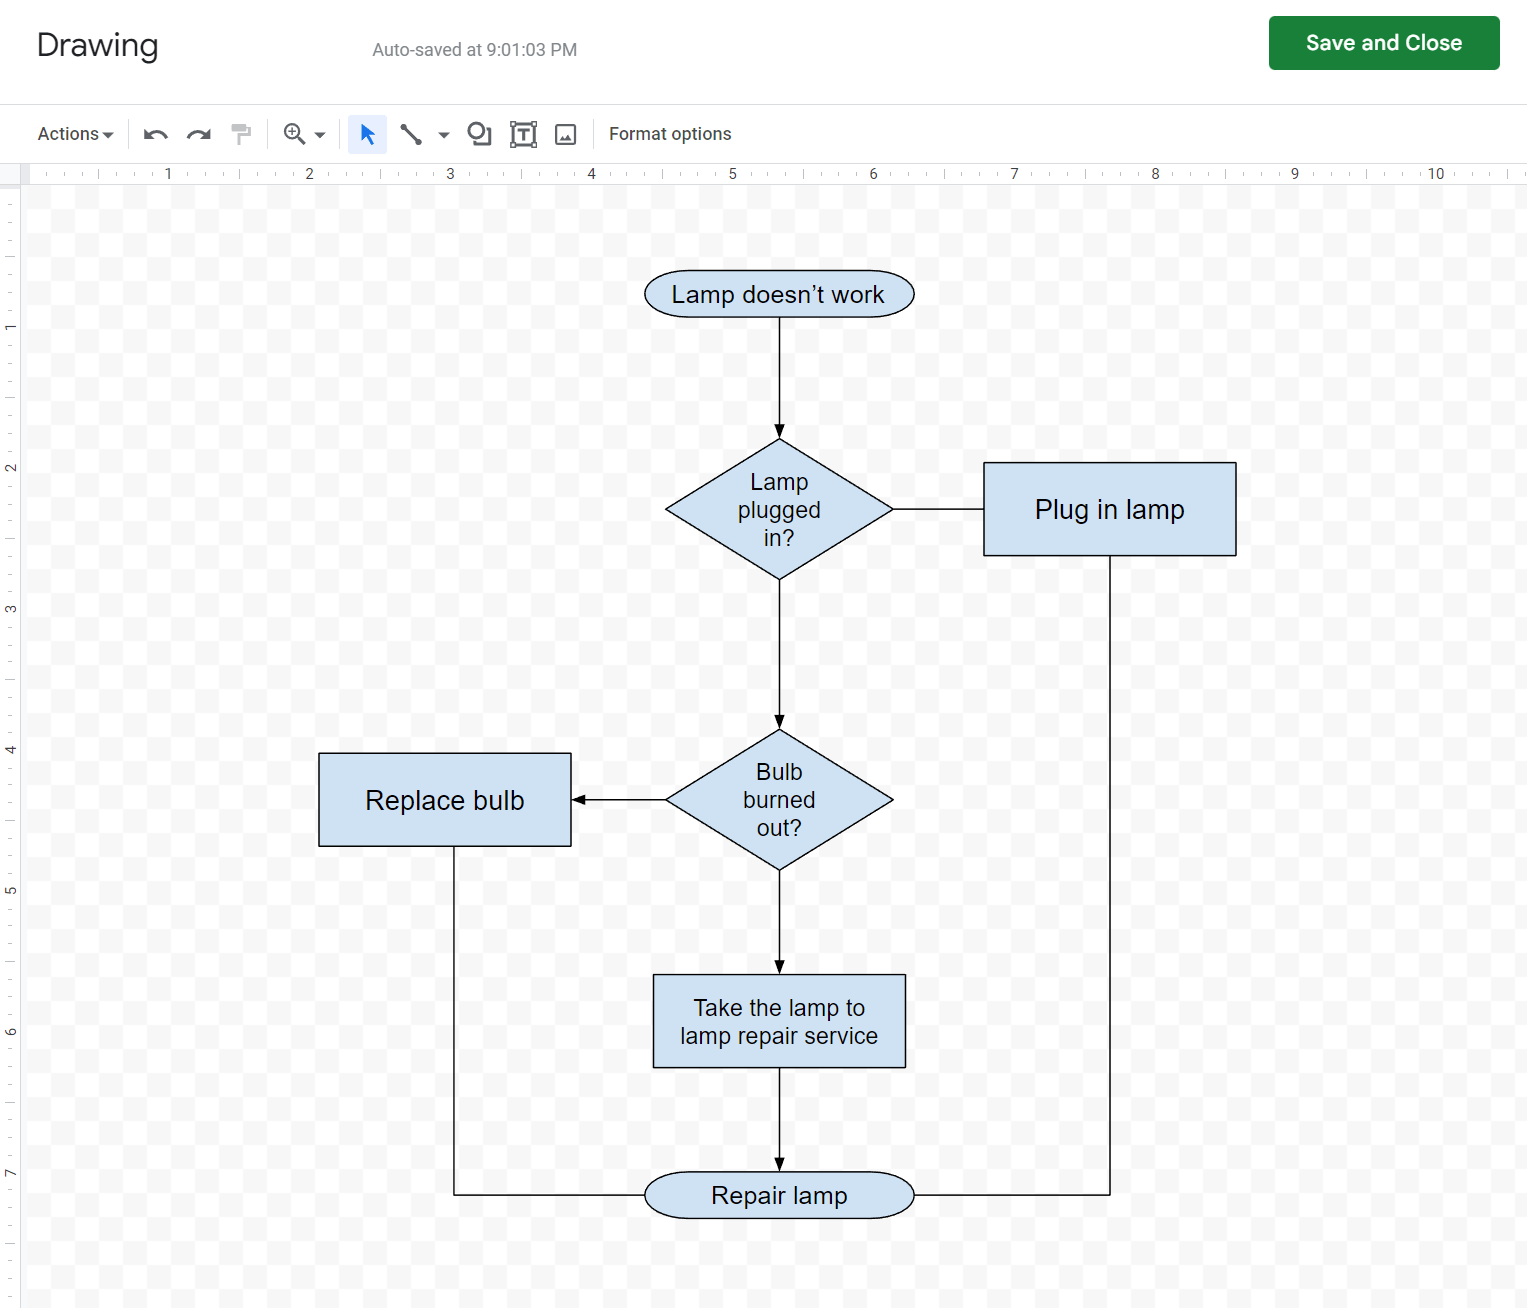
Step 6: Create text boxes to visualize decision trees. In the toolbar, select “Text box”, draw a text box in the area you need to, type “Yes” or “No” near the diamond flowchart shapes to showcase potential options.

Here’s what our flowchart looks like at this stage of the process:

Step 7: Move the flowchart to your spreadsheet by clicking the “Save and Close” button.
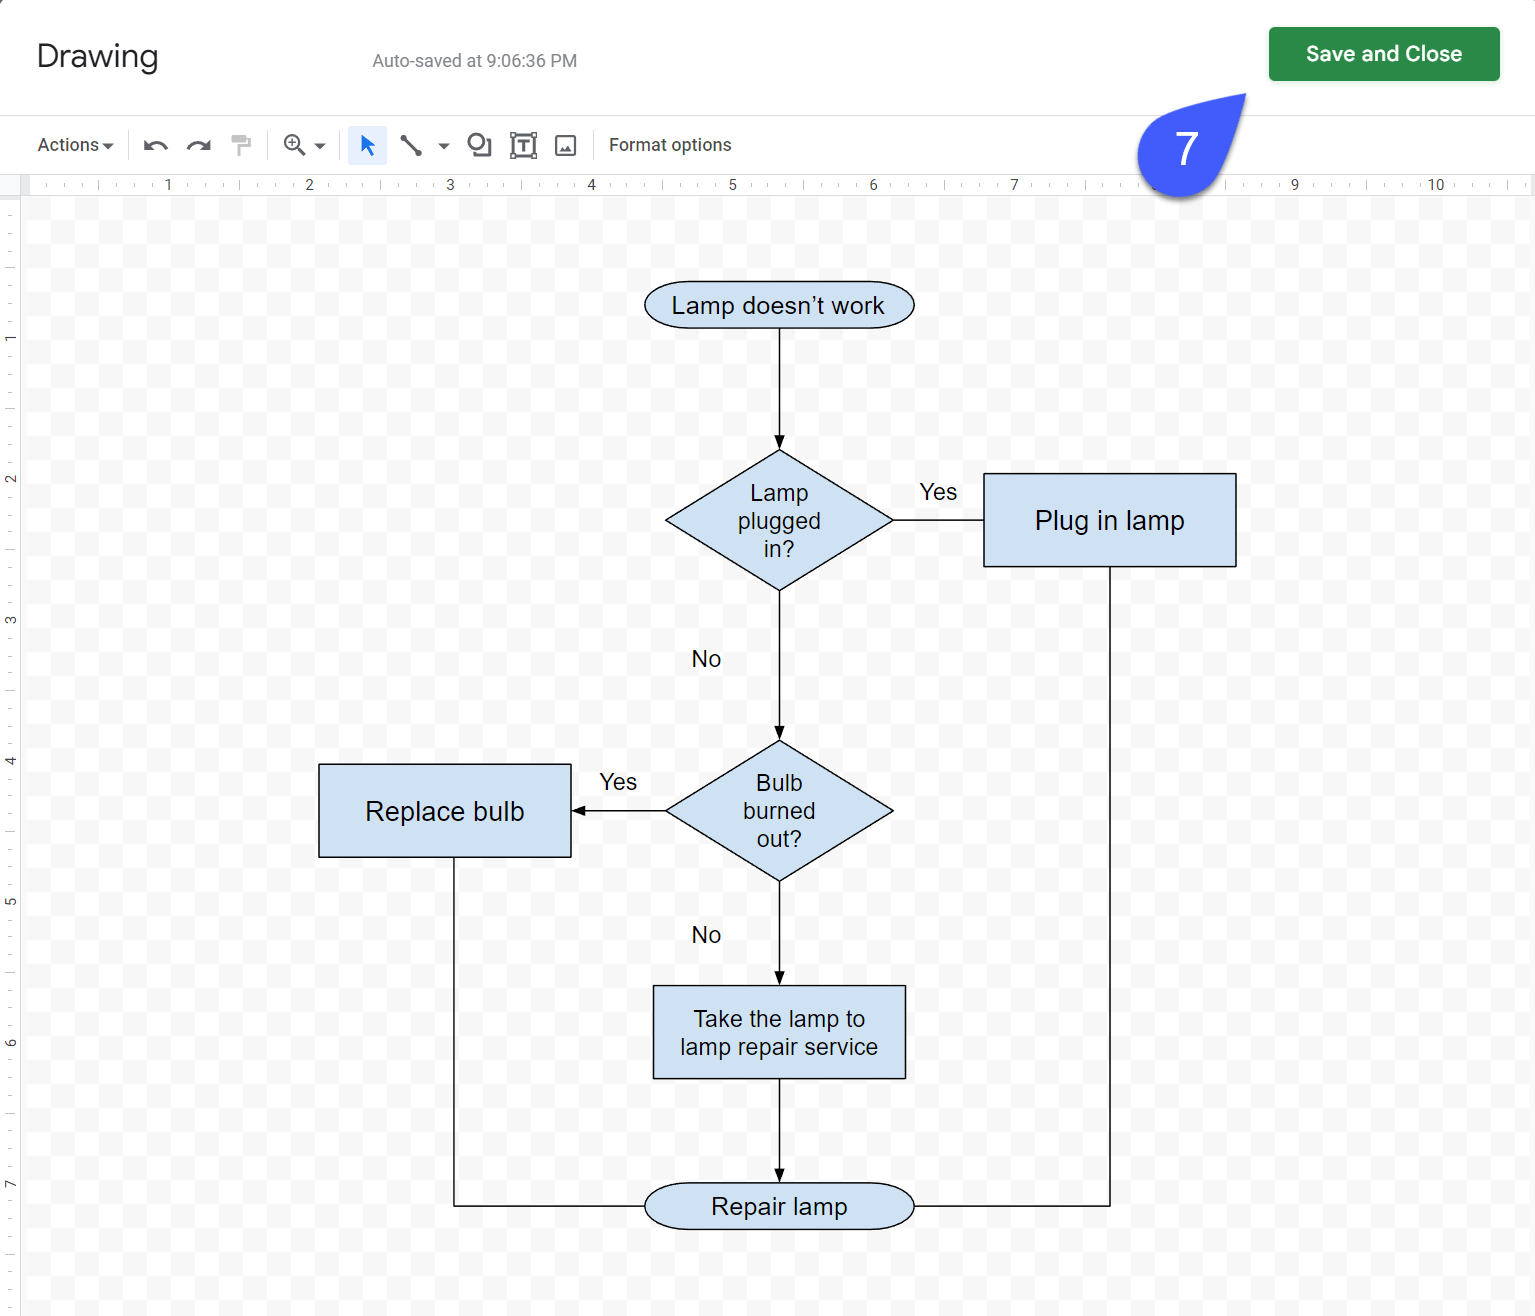
Finally, you get your nice-looking Google Sheets process flowchart.
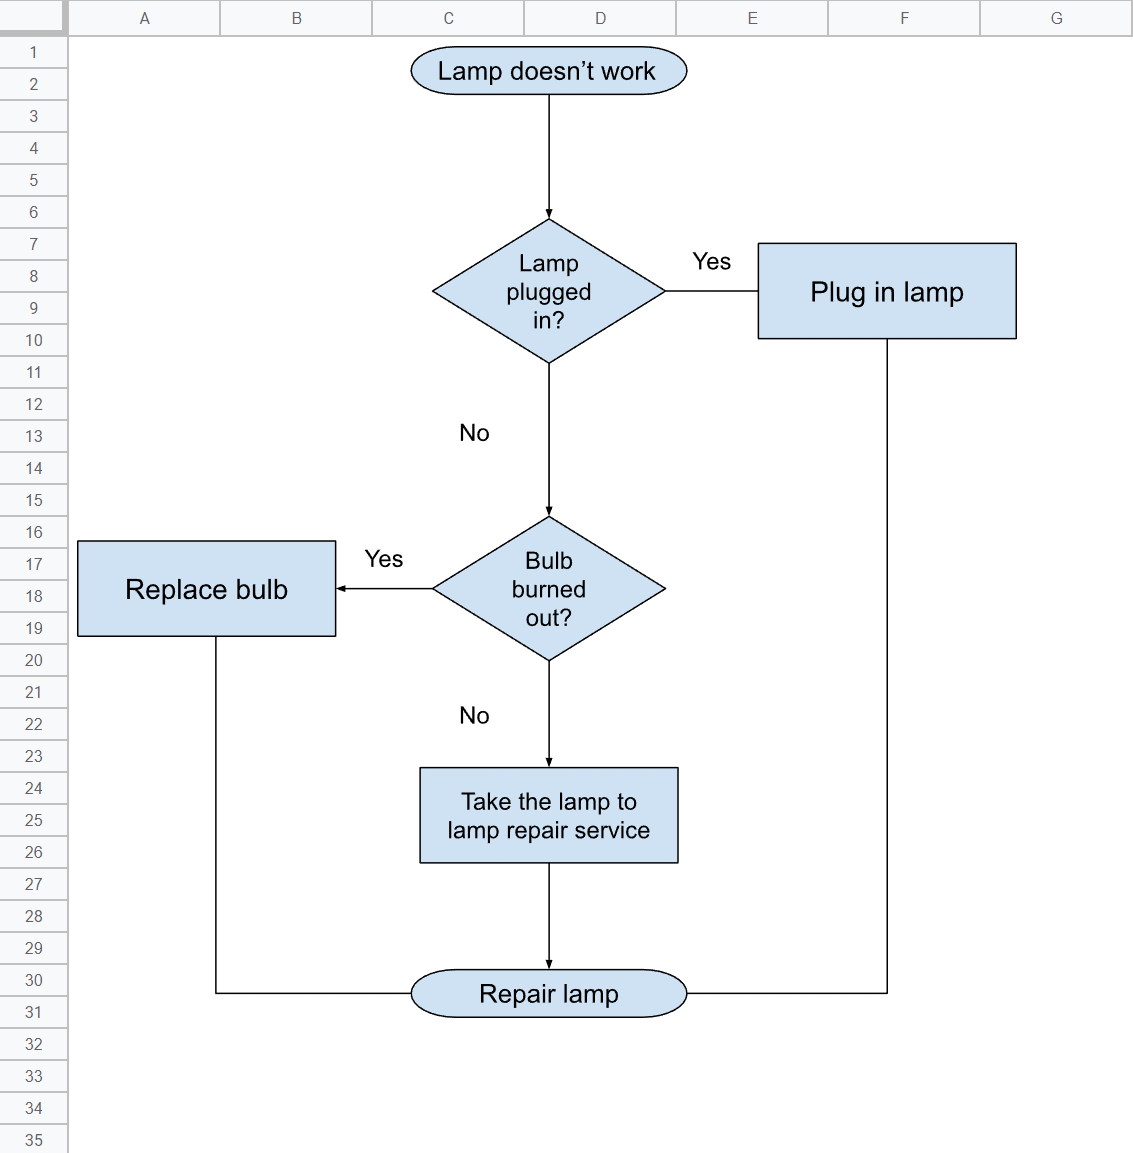
- Note: Of course, you don’t need to wait until you have all the shapes mapped out to create connectors or text boxes. We just needed to show you the process from A to Z.
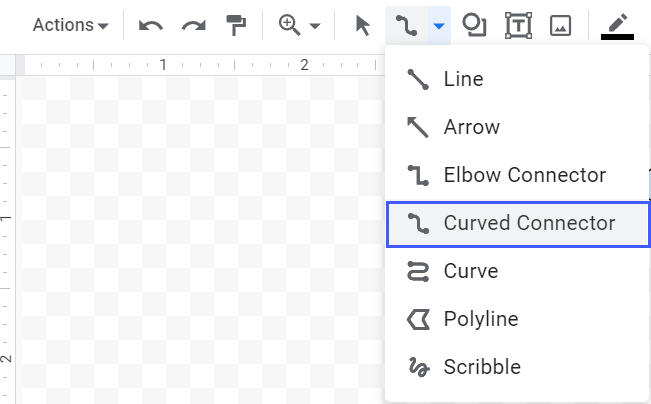
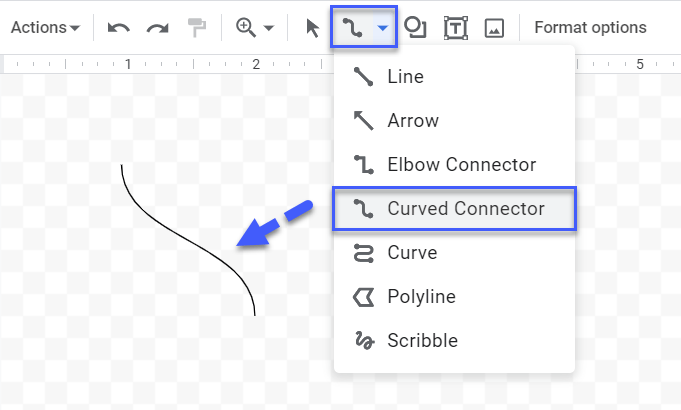
- Note #2: You can use the same steps mapped out above to create a circle flowchart in Google Sheets. The only thing is that we’d recommend you use the “Curved Connector” option to showcase the steps of your cycle.
The biggest shortcoming of this method is that the drawing area is pretty limited, so you’d have to create multiple flowcharts and tie them together, making it more difficult to map out complex process chains.
Flowchart Symbols & Shapes in Google Sheets
Google Sheets offers 28 built-in flowchart shapes and symbols as well as three major types of flow line connectors to help you visualize virtually any process you can think of.
In this section, we’ll take a deep dive into each flowchart shape supported in Google Sheets.
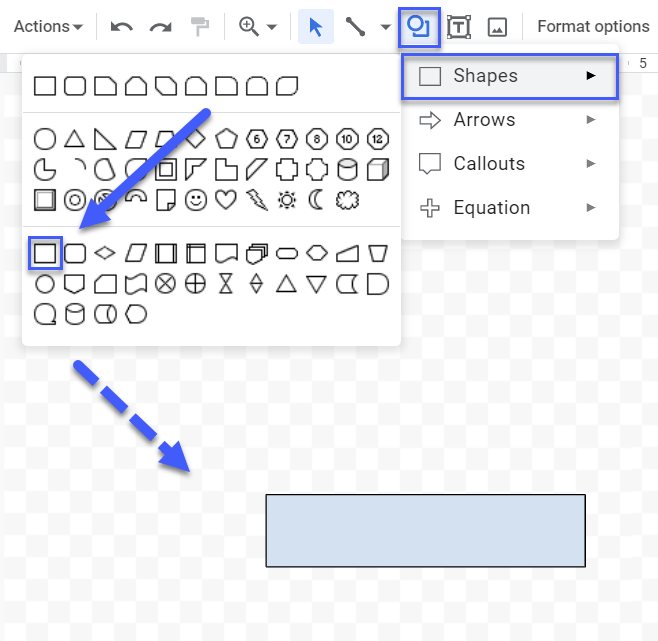
Flowchart: Process
Use the process flowchart shape to illustrate an action step of a process. This shape is one of the most common flowchart symbols.
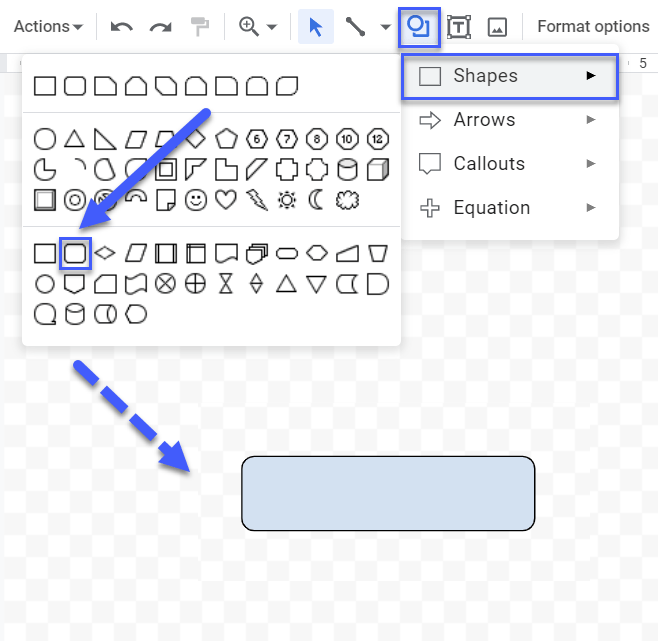
Flowchart: Alternate Process
The alternate process flowchart shape is designed to visualize an alternative step in a process. Use dashed lines as connectors to illustrate that a given option is an alternative.
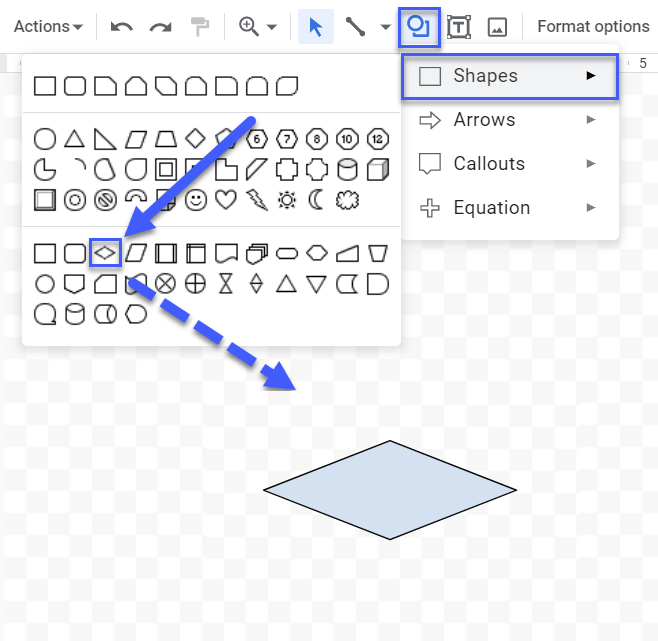
Flowchart: Decision
The decision flowchart shape is used to map out a question in the flowchart process. It’s common for the question visualized with the help of this shape to have only two potential answers (Yes or No).
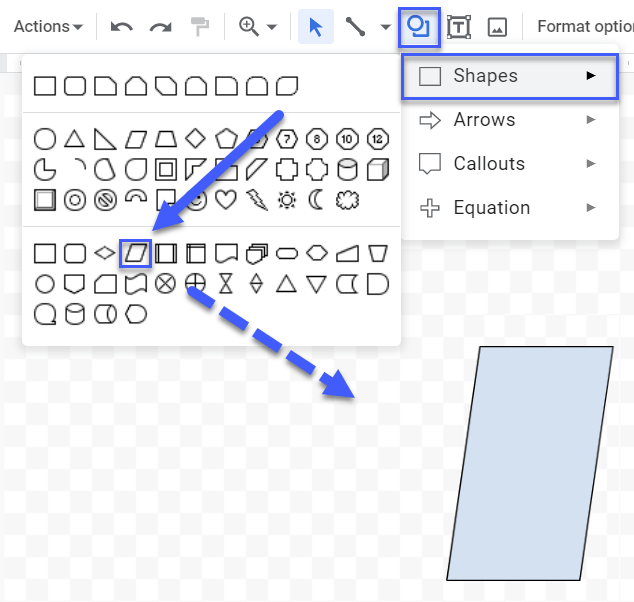
Flowchart: Data
The data flowchart shape is designed to help you illustrate either input or output from a given process.
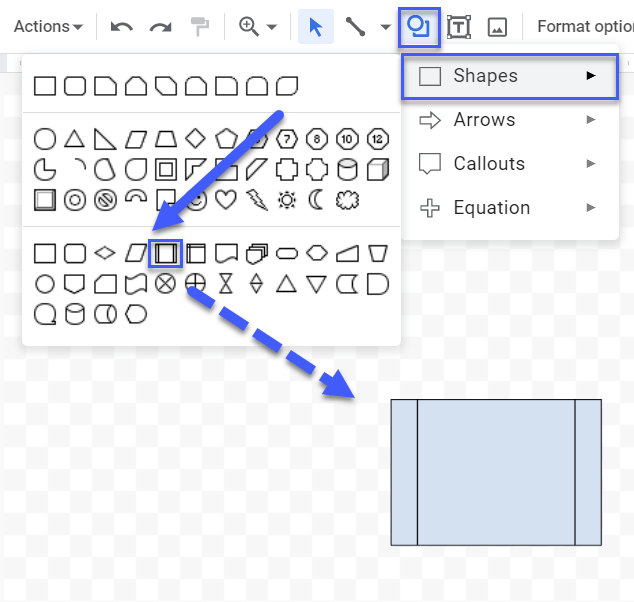
Flowchart: Predefined Process
The predefined process flowchart shape is typically used to depict an action step, a process, or a sub-process covered somewhere else. Basically, this shape is used to refer to other processes within a flowchart, allowing the creation of complex webs of interconnected steps.
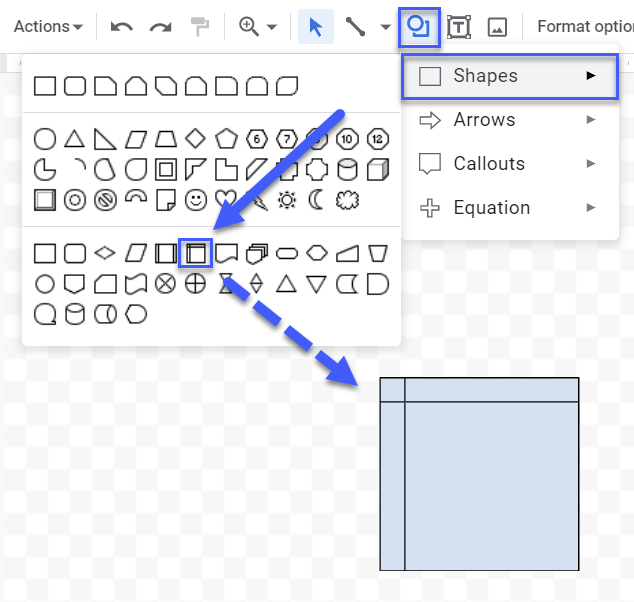
Flowchart: Internal Storage
The internal storage flowchart shape is used to depict the storage of information in computer memory (RAM) rather than on a hard drive. This shape is typically used in programming and software development to illustrate how the system should process data and information.
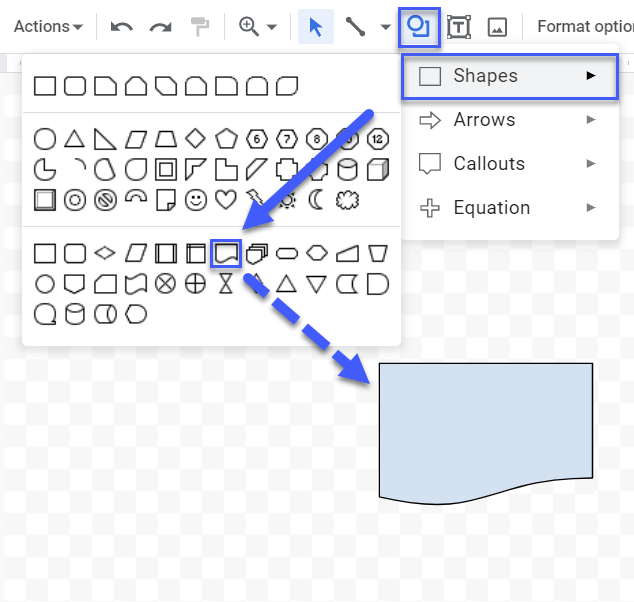
Flowchart: Document
The document flowchart shape is an action step that entails the creation of a document or file.
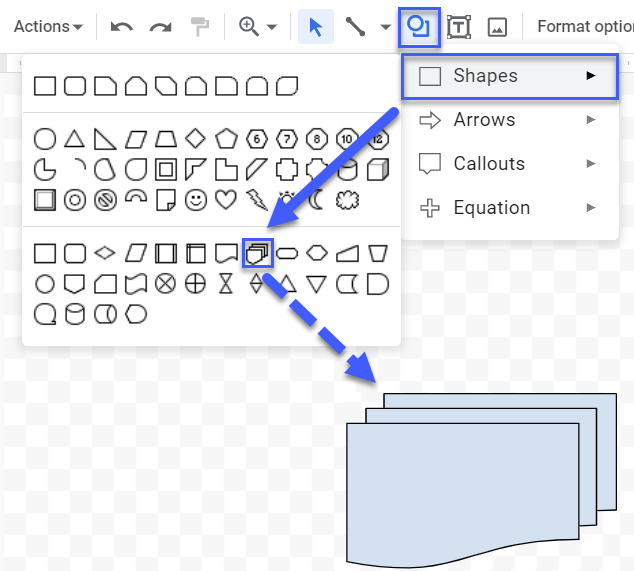
Flowchart: Multidocument
The multidocument flowchart shape depicts an action step that involves the creation of multiple documents or files.
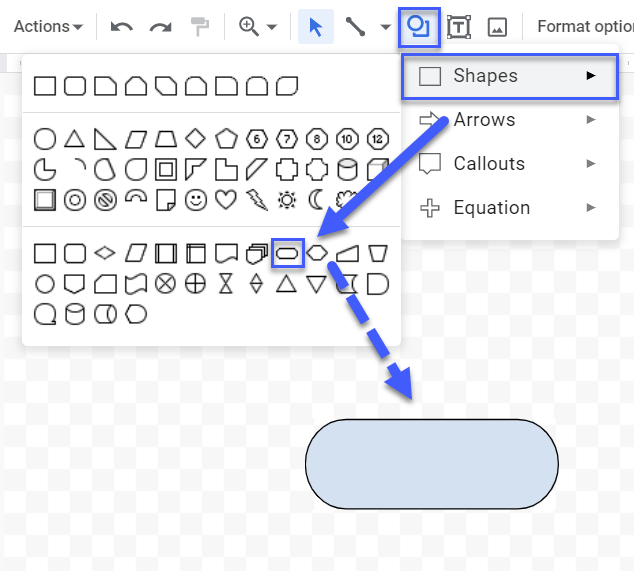
Flowchart: Terminator
The terminator flowchart shape is used to visualize the start and end of your process. This shape triggers or terminates a process chain.
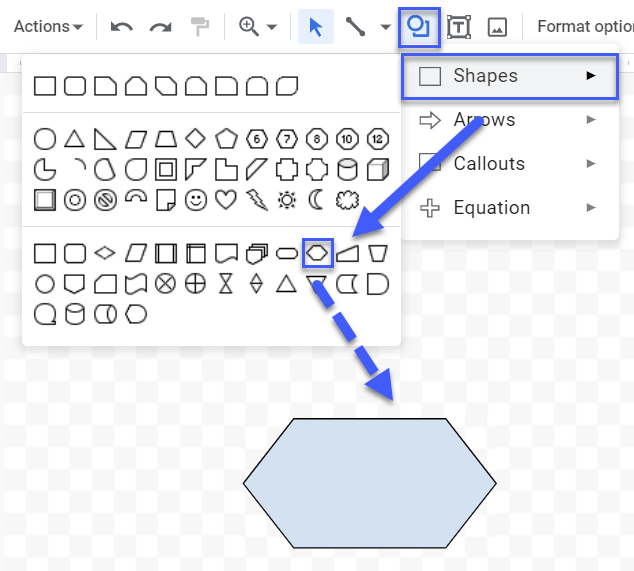
Flowchart: Preparation
The preparation flowchart shape is used to depict a step in which you need to set up something in order to proceed to the next step.
Flowchart: Manual Input
The manual input flowchart shape illustrates a step that depicts providing input and is designed to be completely manual vs. automated.
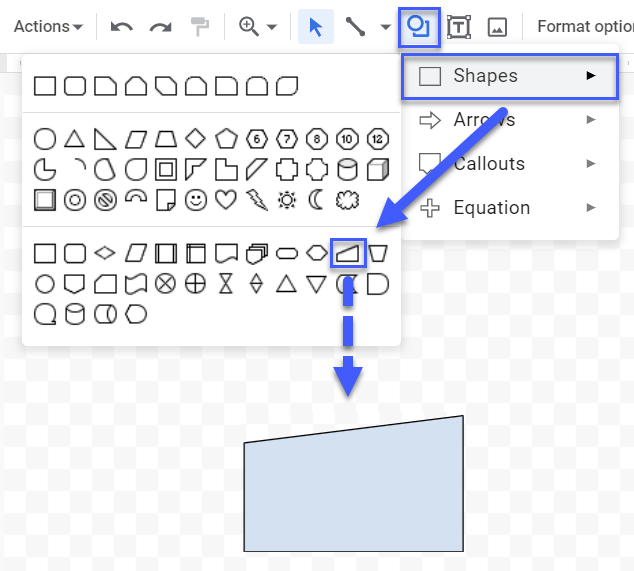
Flowchart: Manual Operation
The manual operation flowchart shape is used to illustrate an action that’s prompted from the user or operator to be performed manually.
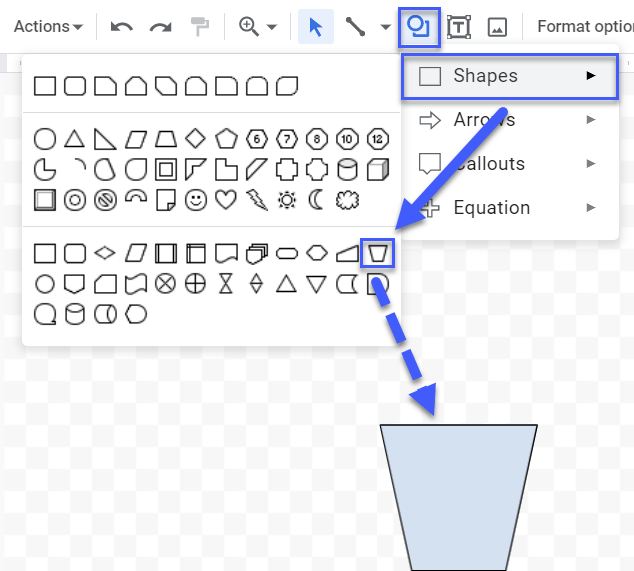
Flowchart: Connector
The connector flowchart symbol is used to illustrate that the flow of the depicted process spans across multiple charts and pages. It’s typically used to tie different pages and charts together, helping visualize complex process chains.
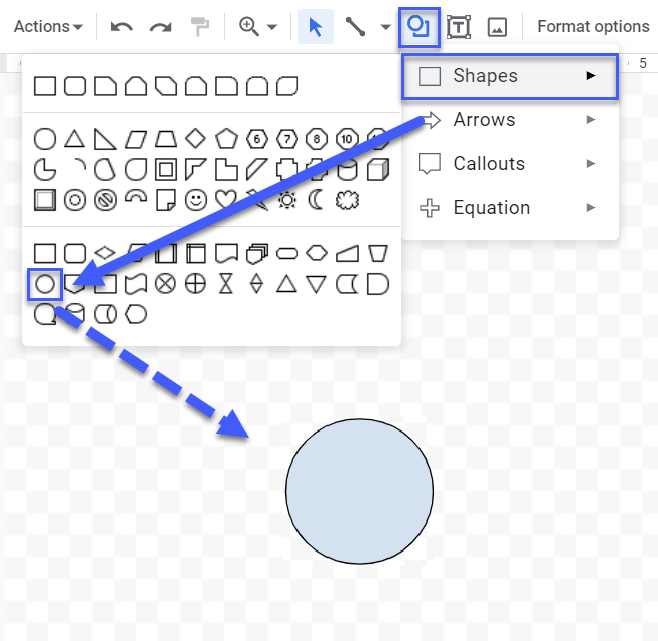
Flowchart: Off-page Connector
The off-page flowchart connector is used to illustrate that the process flow continues on a different page.
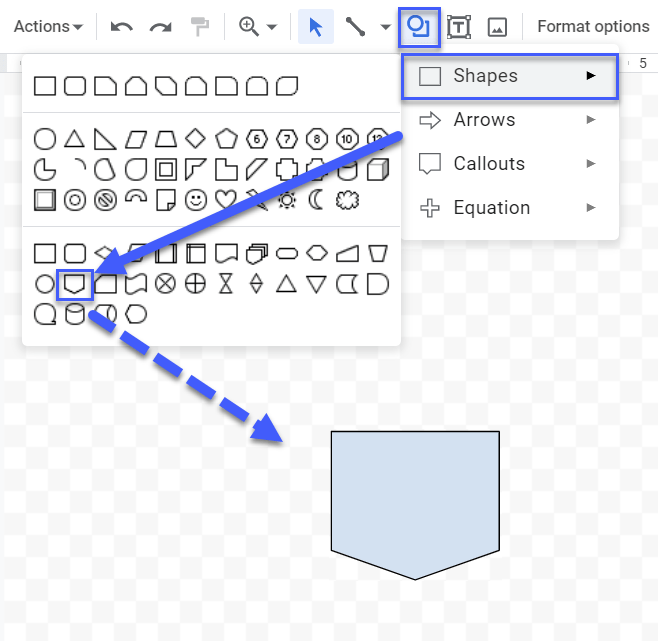
Flowchart: Card
The card flowchart shape is used to illustrate input into legacy systems and old computers.
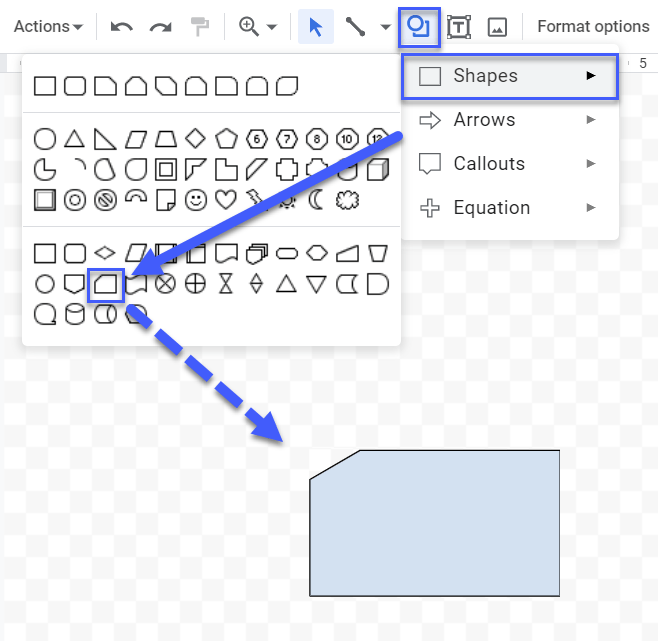
Flowchart: Punched Tape
Similar to Card, the punched tape flowchart shape is used to illustrate input into a legacy (old) system.
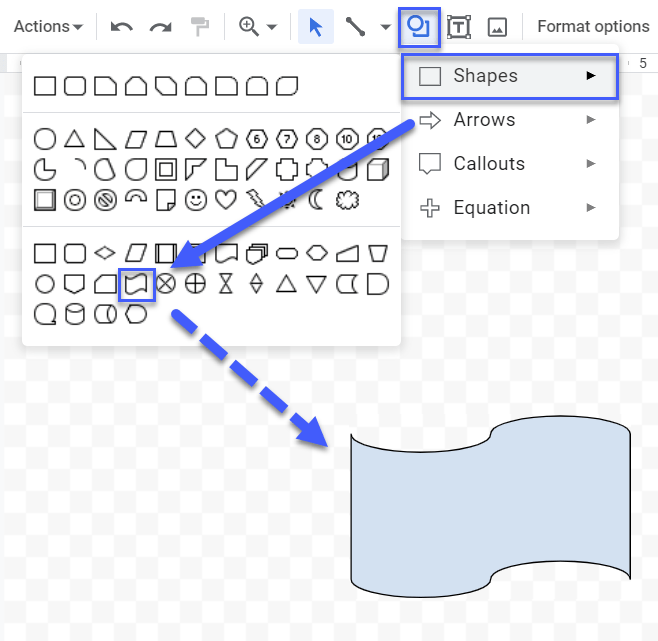
Flowchart: Summing Junction
The summing junction flowchart shape is used to illustrate the convergence of different branches into a single process.
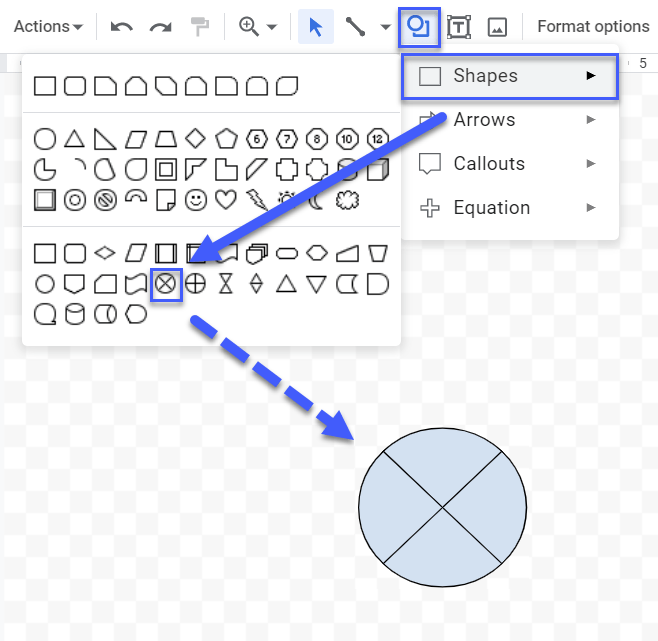
Flowchart: Or
The OR flowchart shape is used to map out the divergence of a process into multiple branches.
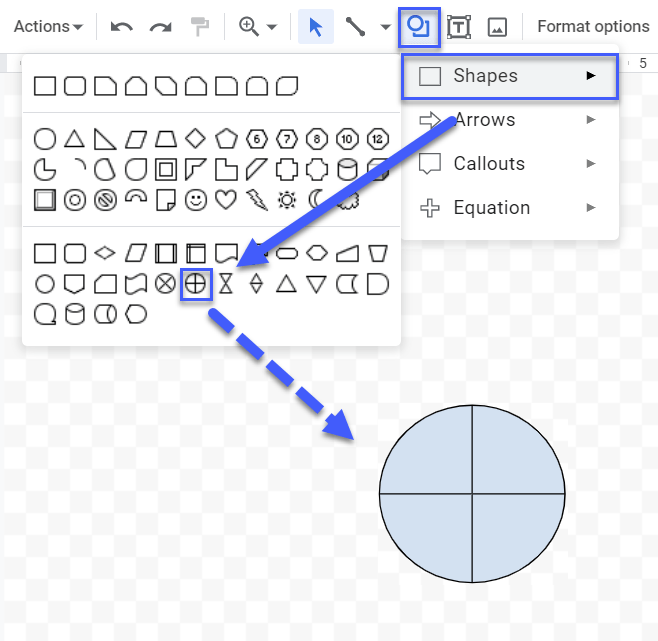
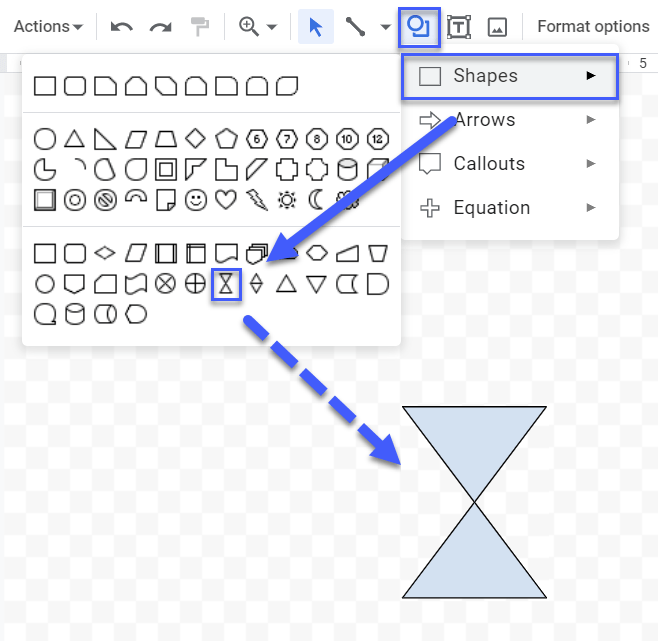
Flowchart: Collate
The collate flowchart shape is used to illustrate a step that involves sorting, organizing, or formatting information according to a predefined standard arrangement or procedure.
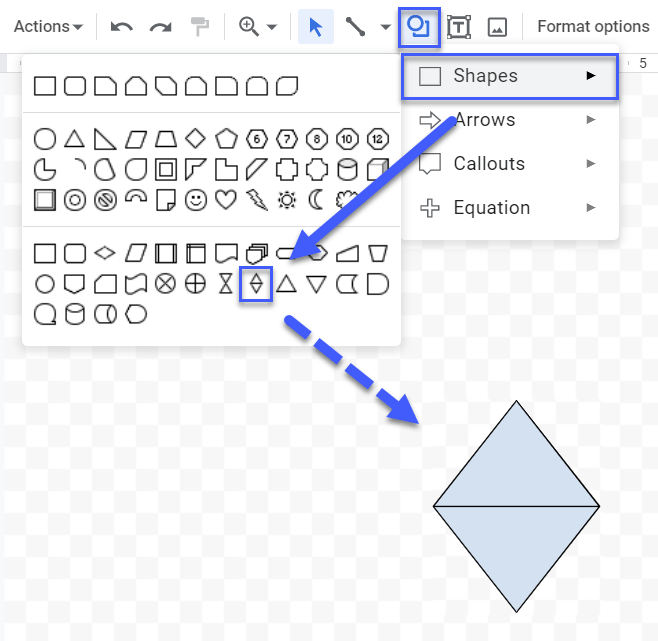
Flowchart: Sort
The sort flowchart shape is used to illustrate a step where data or material is sorted in a known, standardized order.
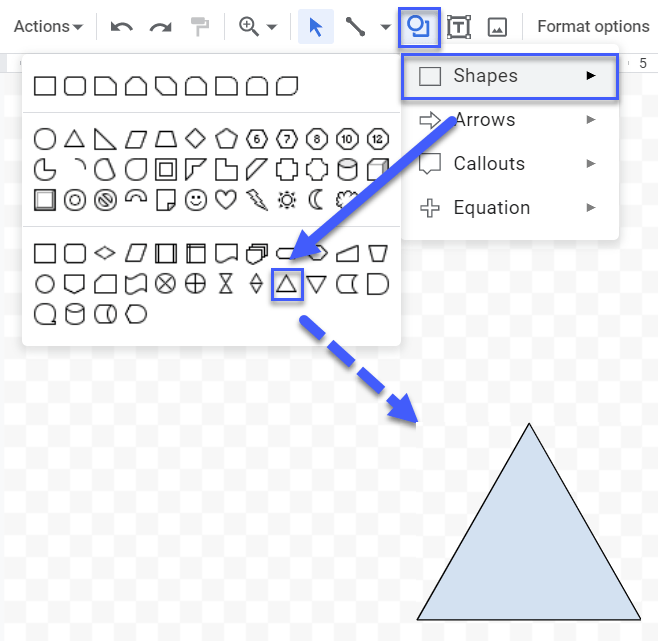
Flowchart: Extract
The extract flowchart shape indicates the extraction of one or multiple items from a set.
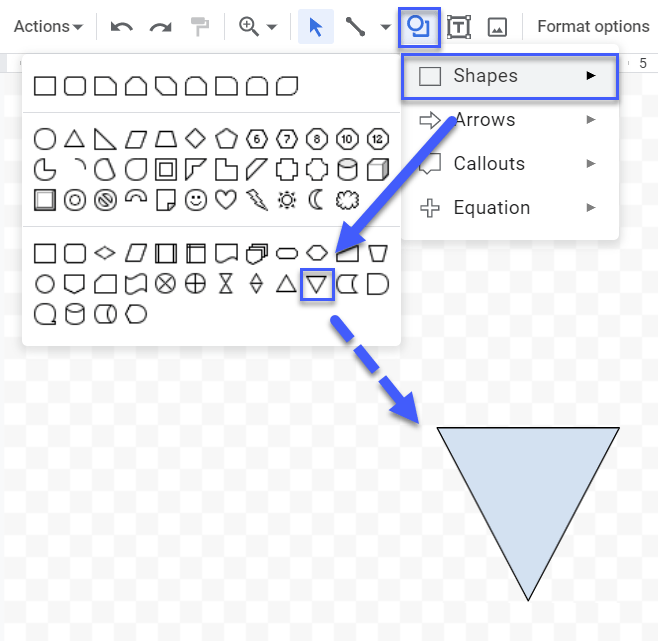
Flowchart: Merge
The merge flowchart shape shows a step where multiple items of data, information, or material are combined into one set.
Flowchart: Stored Data
The stored data flowchart shape is used to illustrate any process step that entails the storage or data, information, or material.
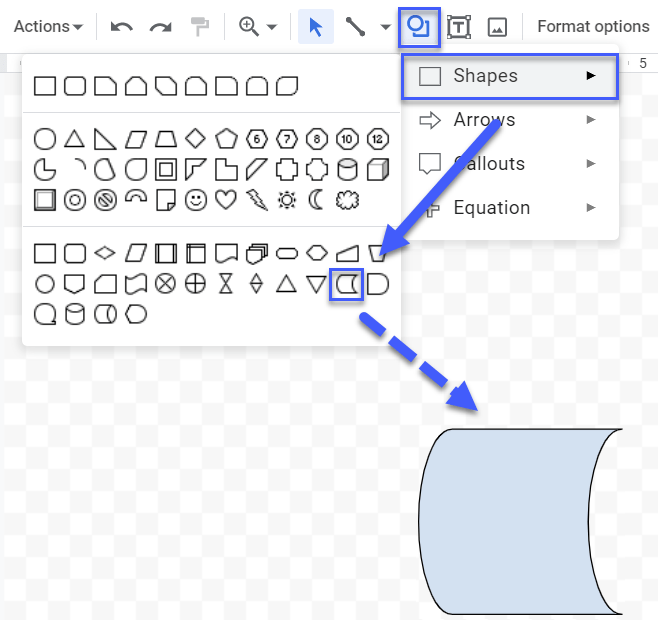
Flowchart: Delay
The delay flowchart shape depicts any waiting period where no actions should be taken as part of the process flow.
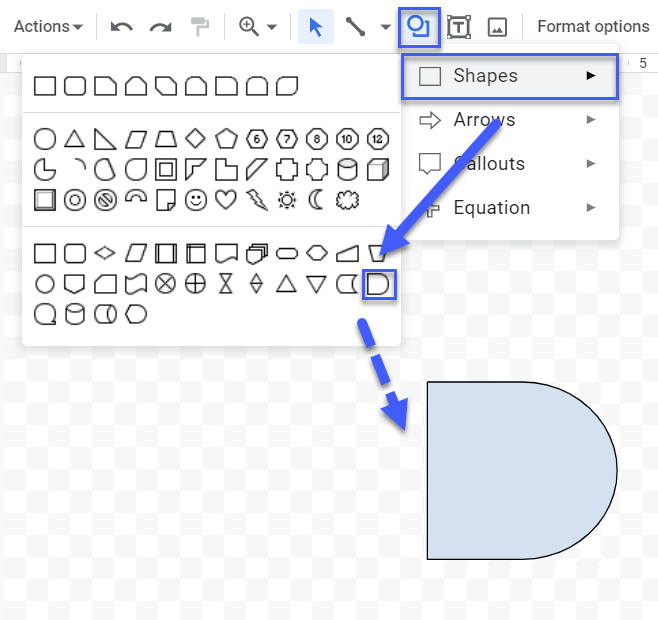
Flowchart: Sequential Access Storage
The sequential access storage flowchart shape shows the storage of information on a magnetic tape.
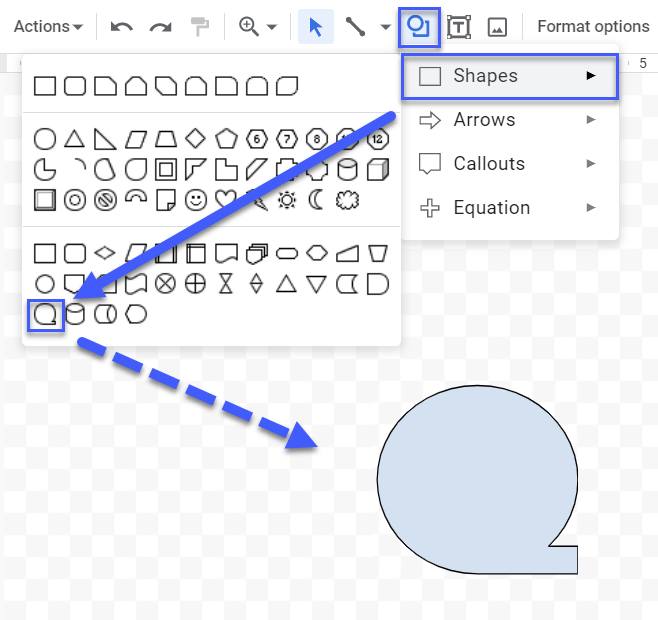
Flowchart: Magnetic Disk
The magnetic disk flowchart shape represents general data storage, be it a database, hard drive, magnetic disk, or legacy system.
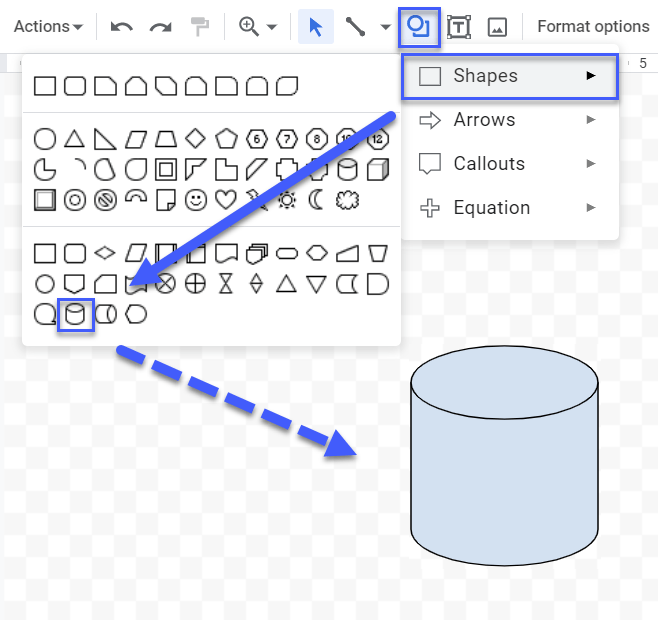
Flowchart: Direct Access Storage
The direct access storage flowchart shape represents your hard drive.
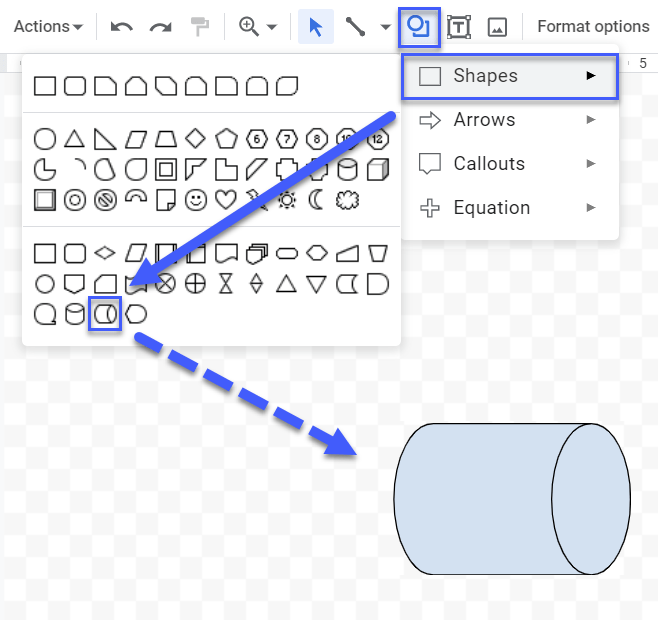
Flowchart: Display
The display flowchart shape represents a step where information or data is presented to the end-user.
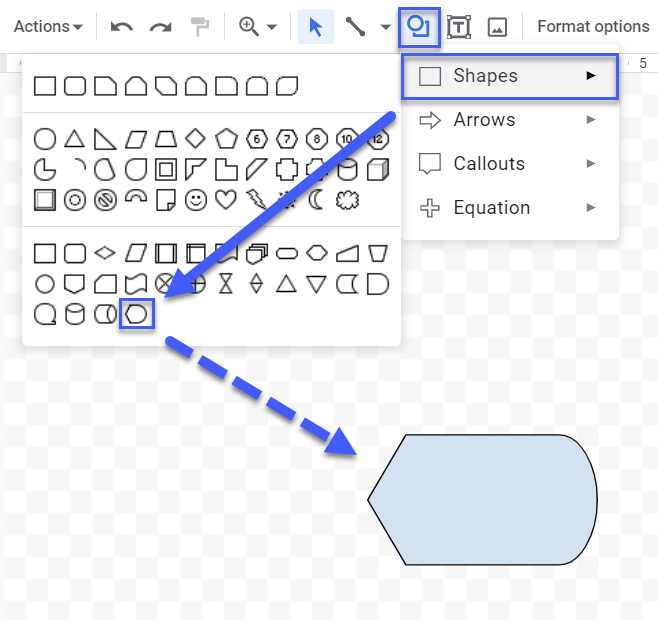
Flow Line Connector Types in Google Sheets
In flowcharting, there are multiple flow line connector types used to visualize how separate steps of the process relate to each other.
Google Sheets offers you three major connector types that get you 90% of the way. For more advanced types of connectors, use advanced flowchart software.
Let’s quickly go through the types of flow lines you can use in Google Sheets.
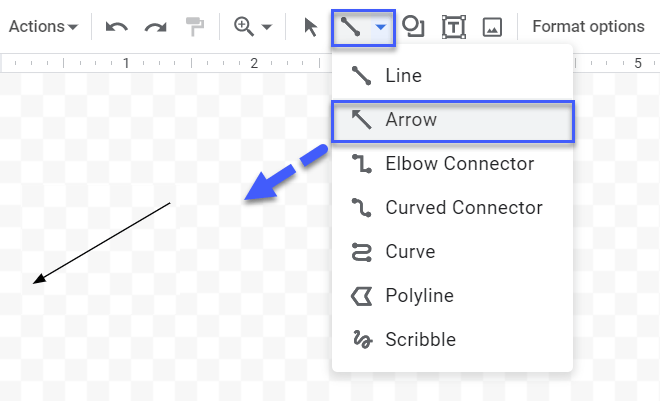
Arrow
The arrow connector (the straight connector) is the simplest way to connect to flowchart shapes between each other.
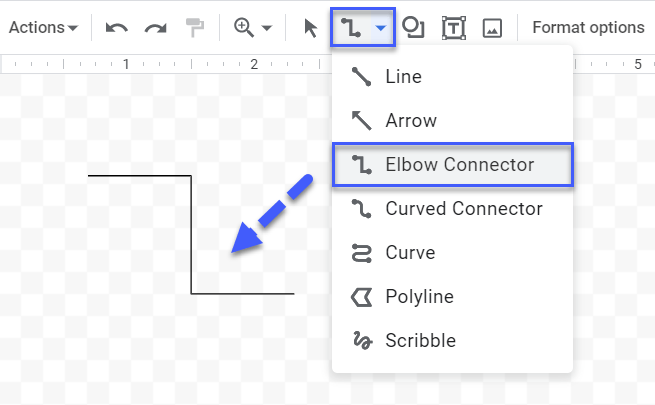
Elbow Connector
The elbow connector is used when the straight connector fails to get the job done and is especially helpful for creating org charts in Google Sheets.
Curved Connector
The curved connector is the least popular type of flow lines and is typically used for building circle flowcharts in Google Sheets.
Google Sheets Flowchart Template
Grab a free copy of our free Google Sheets flowchart template to save yourself some time on creating your process flows.
Flowcharts in Google Sheets: FAQs
Does Google Sheets Have a Flowchart?
Yes, Google Sheets offers 28 flowchart shapes and multiple connector types, allowing you to create a flowchart of any complexity.
Is there a Shortcut for Creating a Flowchart in Google Sheets?
No, there are no shortcuts allowing you to quickly generate a flowchart in Google Sheets.
What Are the Best Add-ons for Creating a Flowchart in Google Sheets?
The best add-ons for creating flowcharts in Google Sheets are Lucidchart, Draw Diagrams, and Bjorn’s GIF-merge.
How Can I Expand or Scale Down the Flowchart Area?
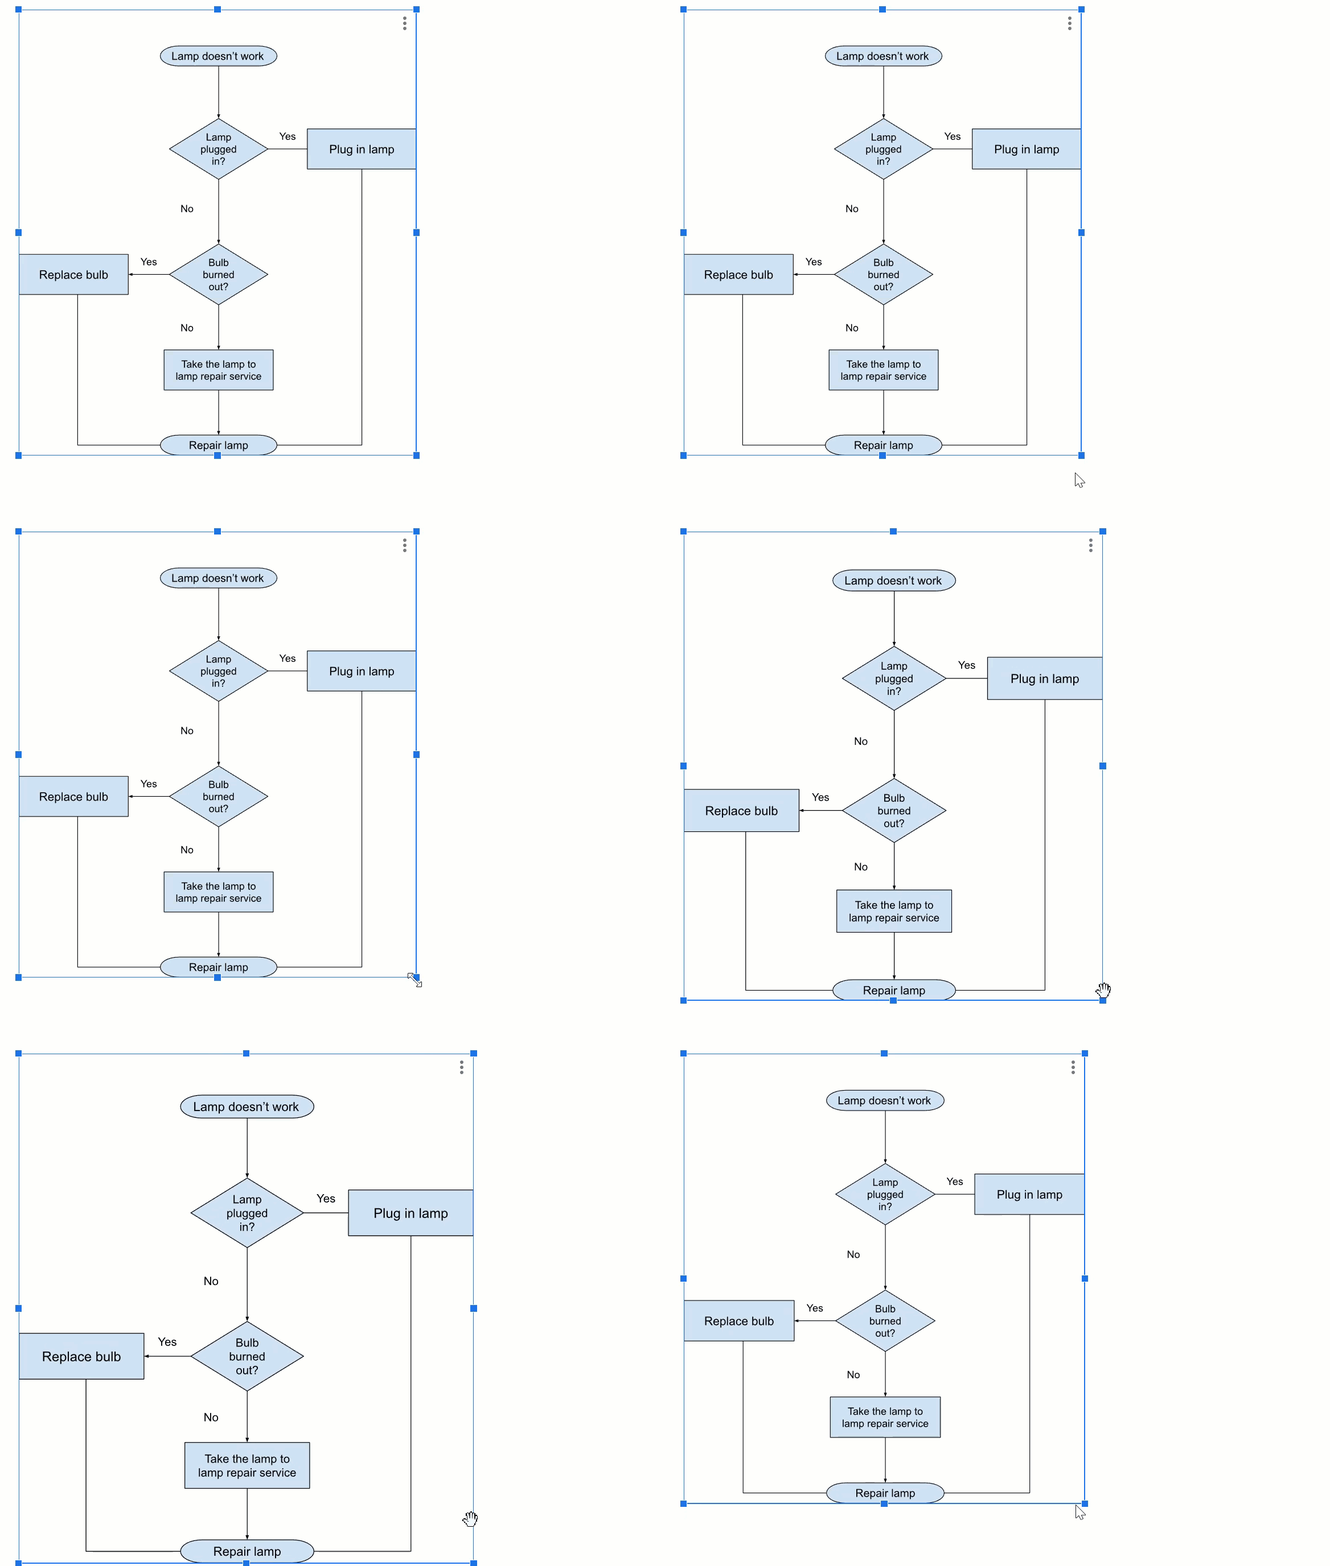
To expand or scale down the flowchart area, select your flowchart and drag the blue marker at the bottom left corner of the charting area to rescale it.
I Want Google Sheets to Take Variables from a Flowchart. Is It Possible?
Unfortunately, it’s not possible to take variables from a Google Sheets flowchart since, from a technical standpoint, the entire charting area is one big drawing.
How Do I Fix My Google Sheets Flowchart Being Too Wide?
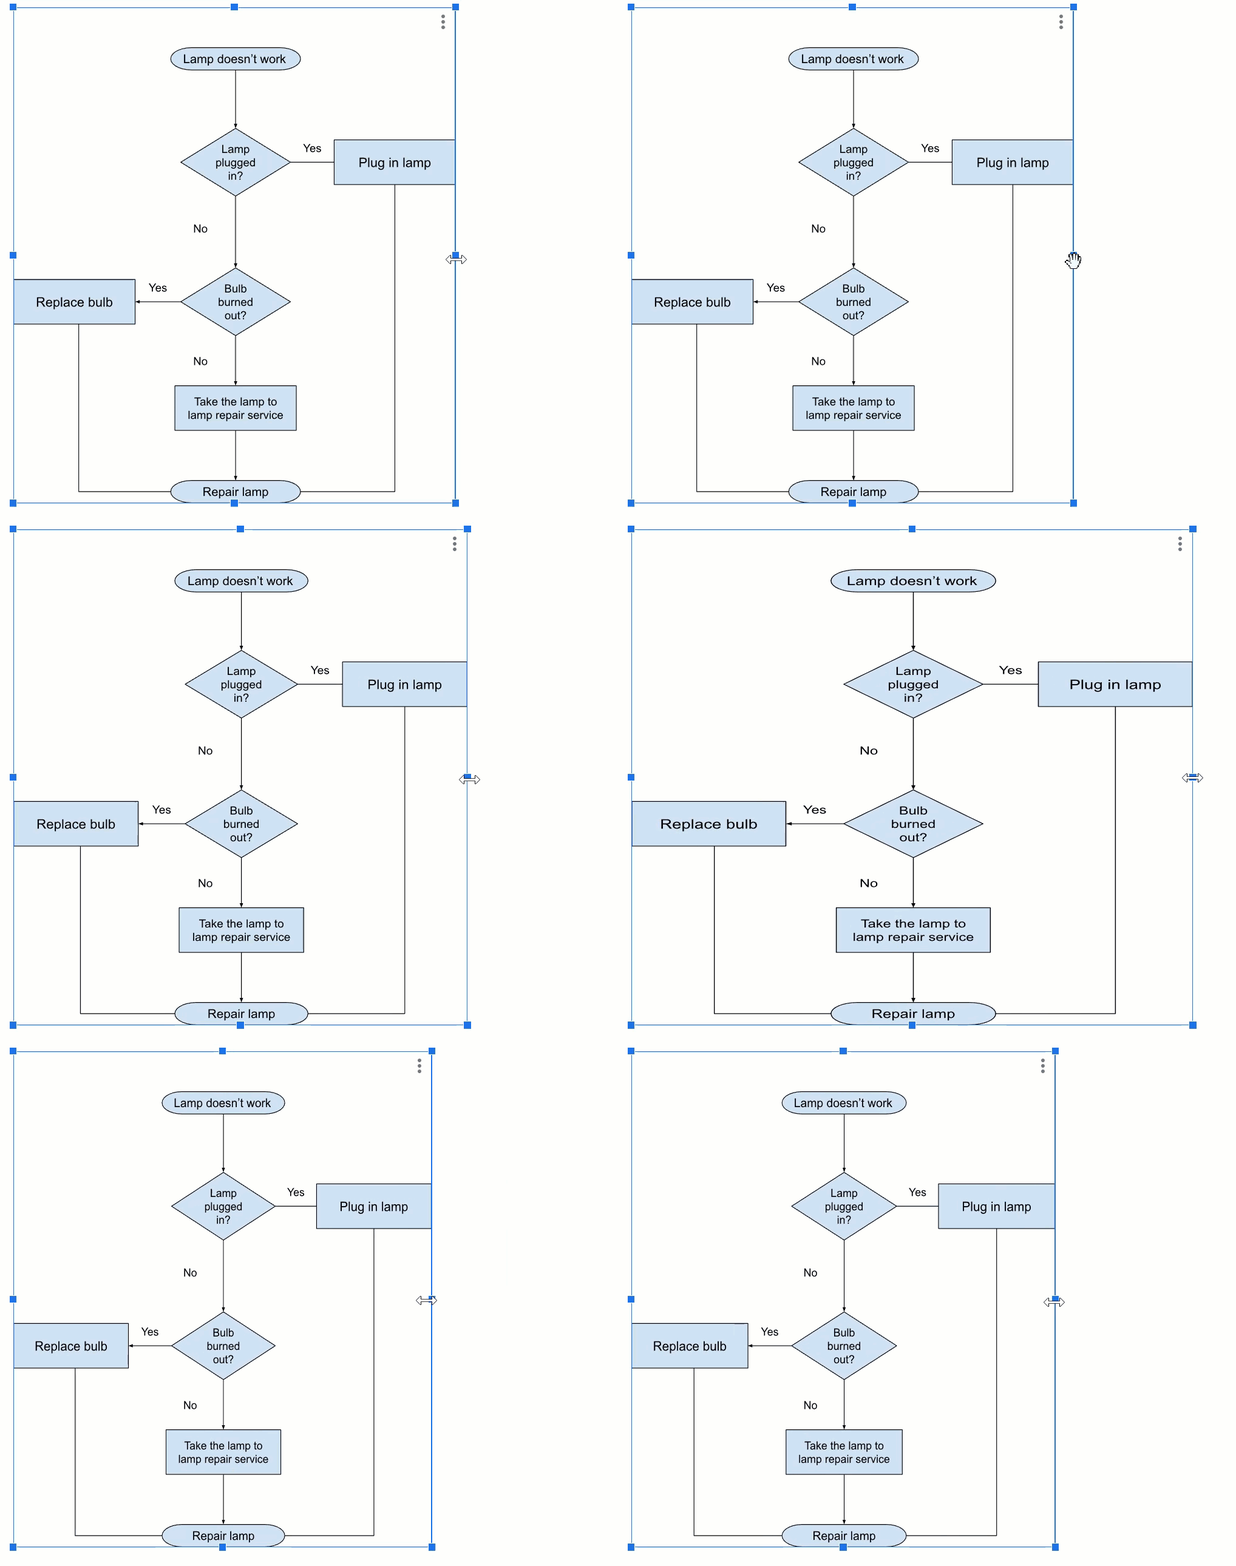
If your Google Sheets flowchart is too wide, select your flowchart and reduce the width of your charting area by dragging the blue marker of your plotting area. See the example below:
