
To make a Venn diagram in Google Sheets, navigate to the Insert menu and select Drawing. In the Drawing window, add Oval shapes that intersect with each other (two or more as you need). Change the Color and Transparency of the ovals to make them look like a Venn diagram. Finally, add Text boxes to insert labels for each section of the Venn diagram.
To see how it’s done step-by-step, check out the article below to review the entire process.
What Are Venn Diagrams?
A Venn diagram is an integral part of set theory, mathematics, statistics, and computer sciences, allowing users to understand the relationship between two or more groups.
Venn diagrams visually reveal which set shares common properties with another set as well as the non-common properties between them. Below are a few examples:
1. For products such as mobile phones, Venn diagrams can compare features that are shared as well as noting which features are different.
2. In biology, Venn diagrams can compare various diseases to see what common and uncommon symptoms they share.
3. Venn diagrams can also be used in literature to compare similarities and differences between two pieces of literature.
How to Make a 2-set Venn Diagram
The most common Venn diagram is the 2-set Venn diagram. It allows users to compare and contrast two sets. The steps to create one for yourself have been divided into two parts:
- Drawing the Venn Diagram
- Formatting the Venn Diagram
Drawing the Venn Diagram
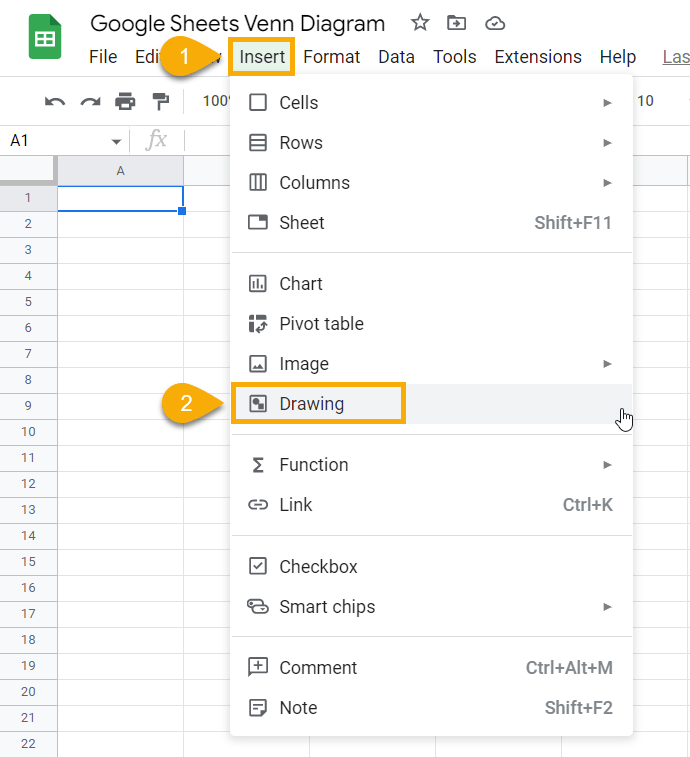
1. In your Google Sheets document, go to the Insert menu.
2. Click on the Drawing option, which allows you to insert a new drawing into the document.
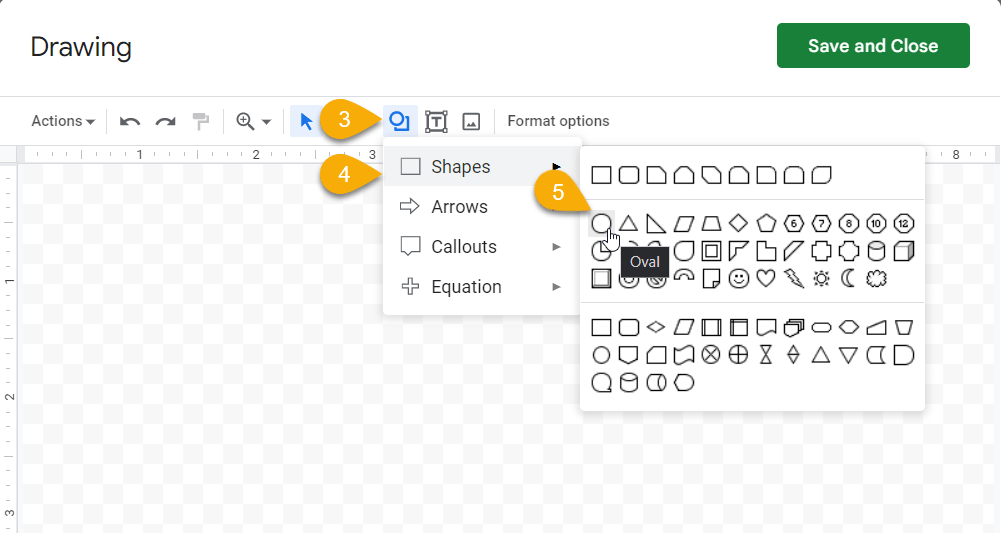
3. In the Drawing window, click on the Shape icon.
4. In the drop-down menu, select Shapes.
5. From the list of shapes provided, choose Oval.
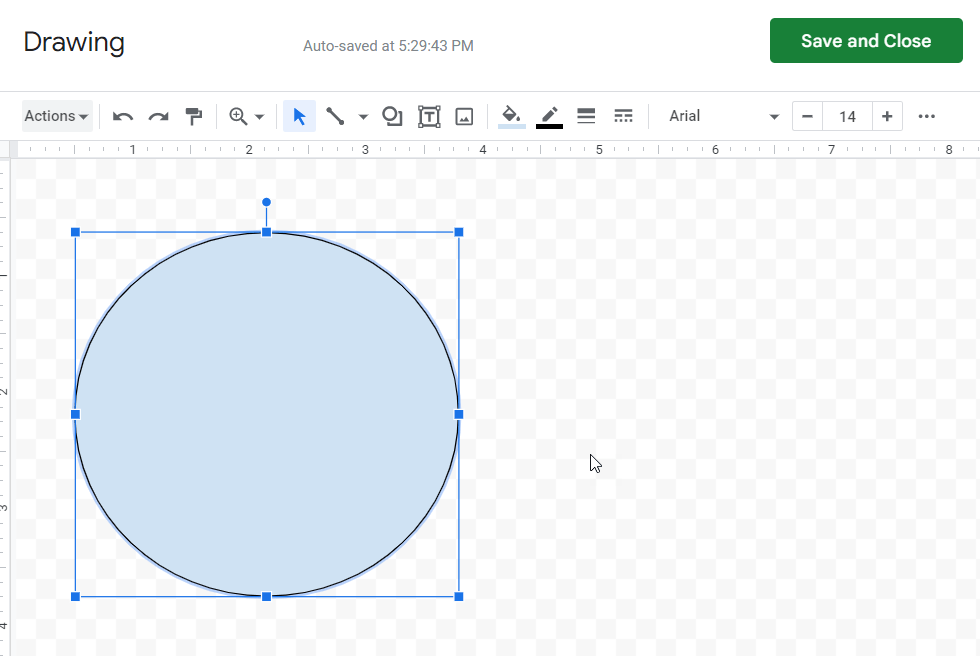
6. Draw an Oval, making sure it’s large enough to include text to label it.
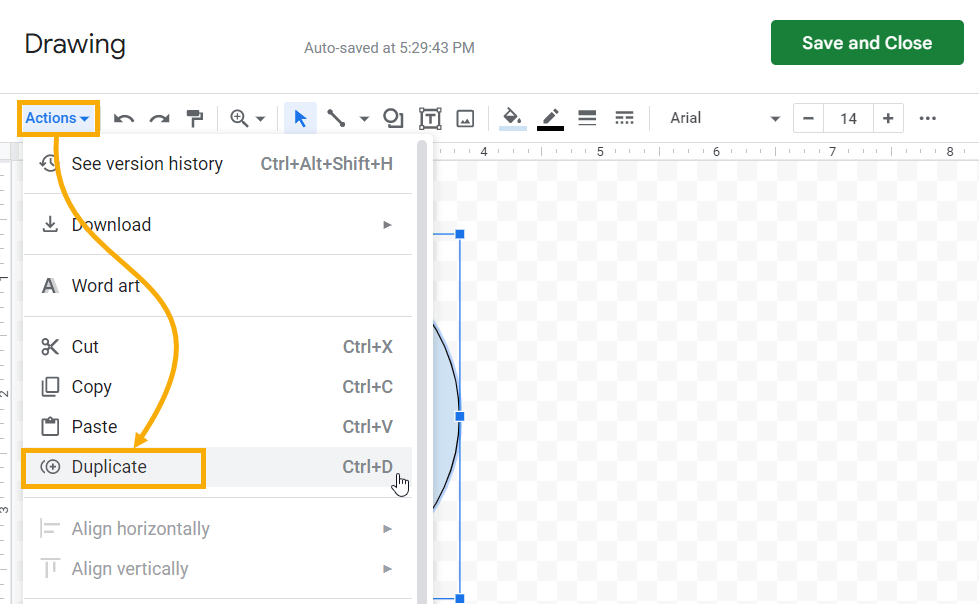
7. Open the Actions drop-down menu from the Drawing window and click on the Duplicate option (keyboard shortcut Ctrl + D). This will make a copy of the oval shape.
8. Arrange the ovals to overlap each other. This is the basic shape of a Venn diagram. 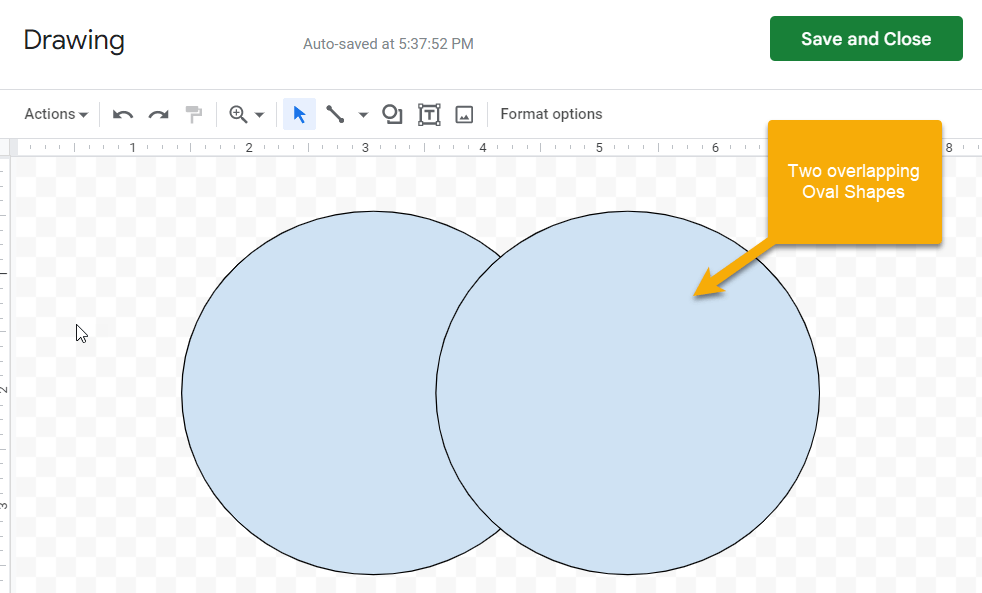
Formatting the Venn Diagram
With the ovals filled with color, we cannot see the overlapping area. We need to format it so we can see that area and add the necessary text to label it. Let’s take a look at how to do that:
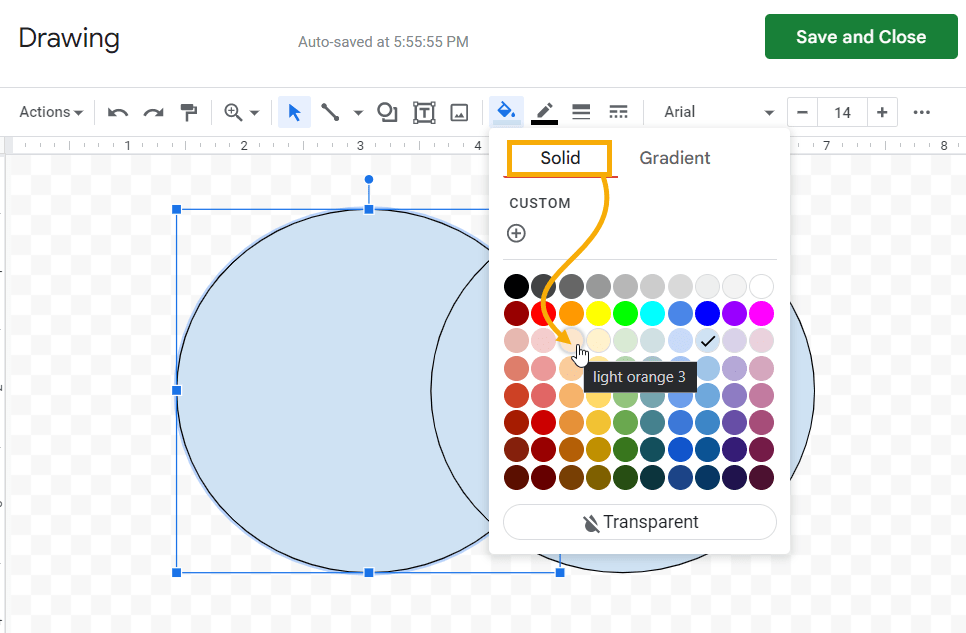
1. Select one of the ovals. Click the Fill color option at the top and choose light orange 3 from the Solid section (or whatever color works best for your diagram).
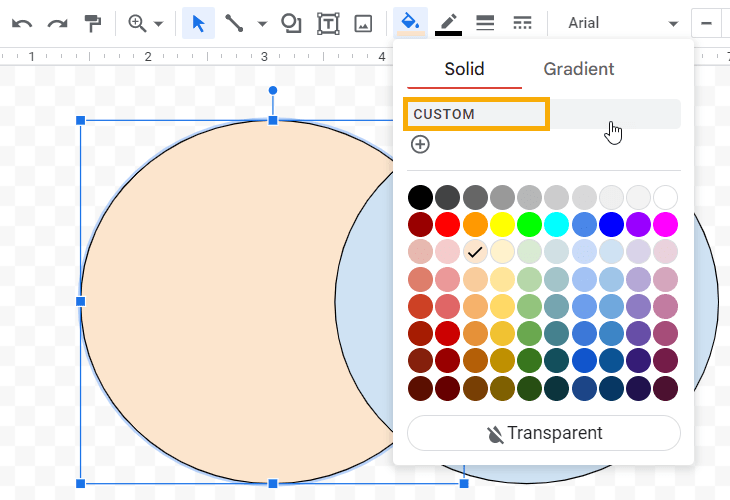
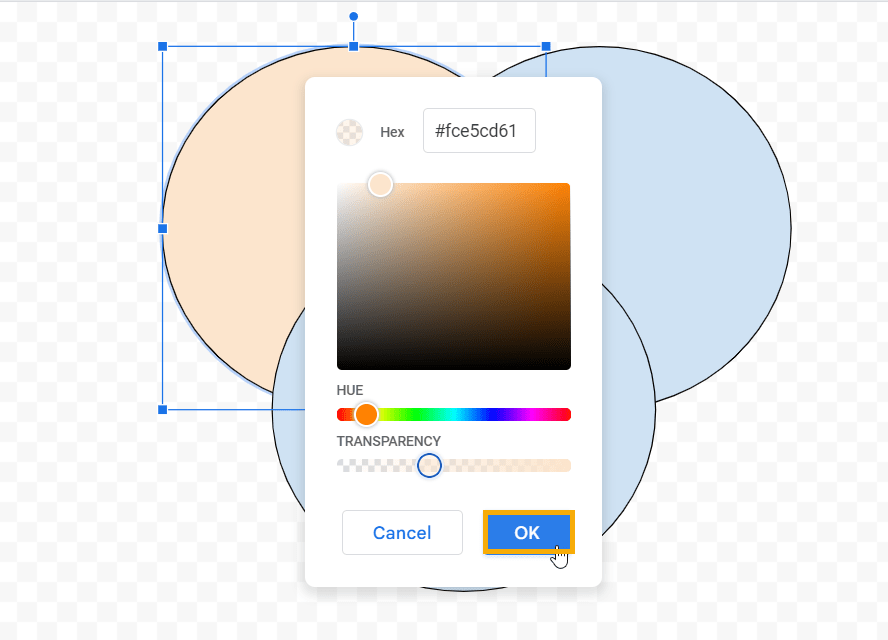
2. Select Fill color again and choose the CUSTOM option in the Solid section. This will open a new color customization window.
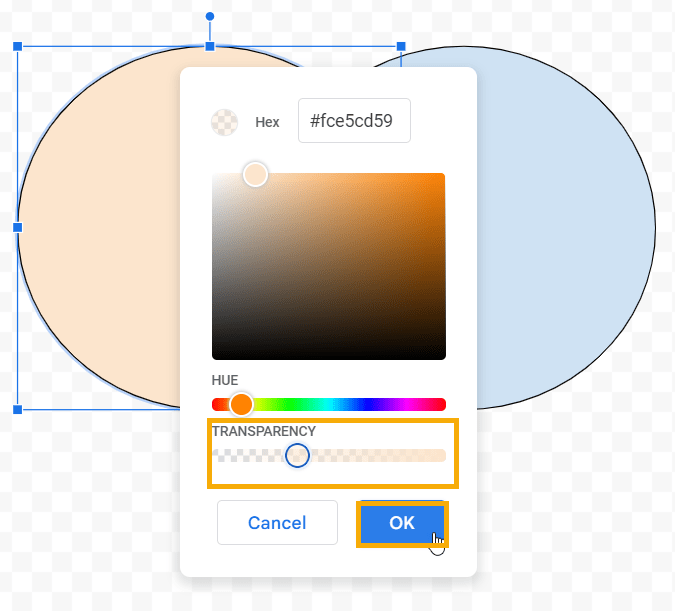
3. From here, you can see that the TRANSPARENCY is set very low (not transparent) by default. Increase the transparency so you can see through to the other oval. When done, click OK.
4. Select the other oval and repeat the steps above to change its color to light green 3. Don’t forget to increase the TRANSPARENCY in the CUSTOM menu.
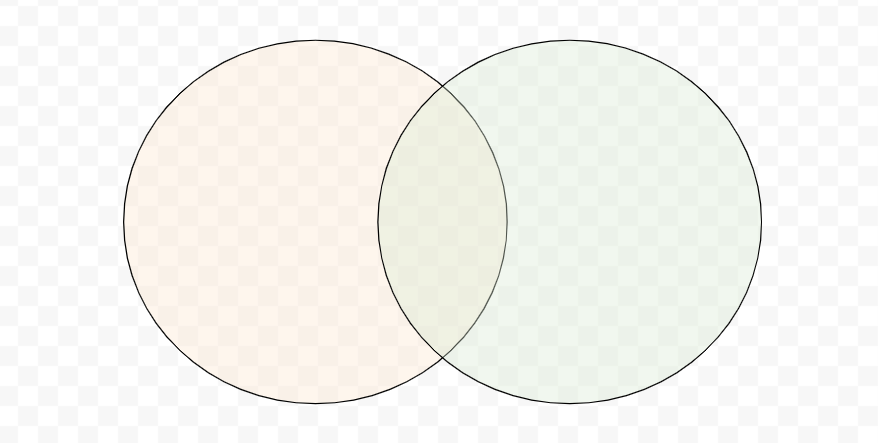
Because of the increased transparency, you can now see the common area where the two ovals intersect.
5. With the ovals now ready, we can insert Text boxes to label each section. Click on the Text box option next to the Shape menu in the drawing canvas.
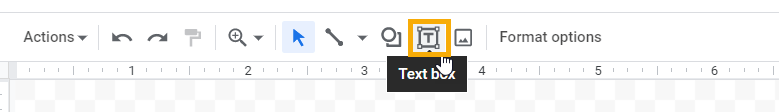
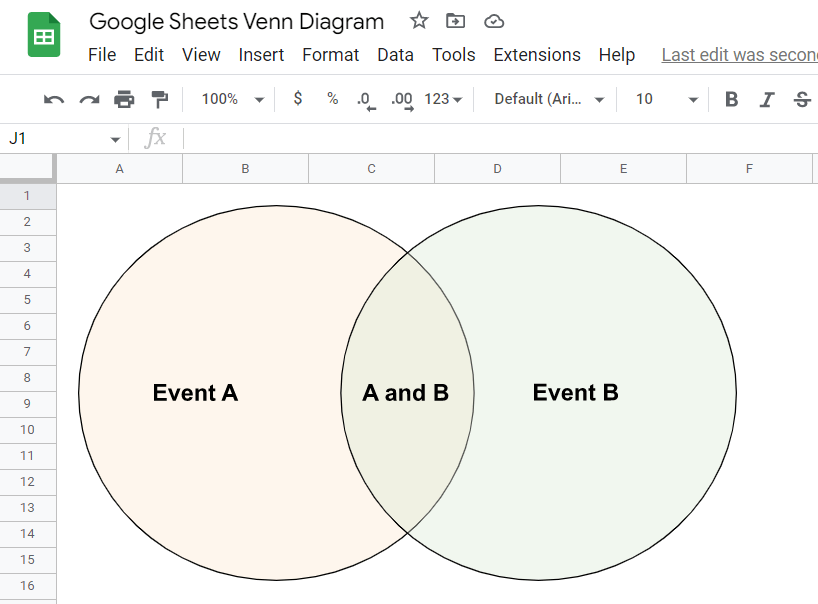
6. Draw text boxes inside the two oval shapes and insert the label text to complete this 2-set Venn diagram. The output should look similar to the one shown below:
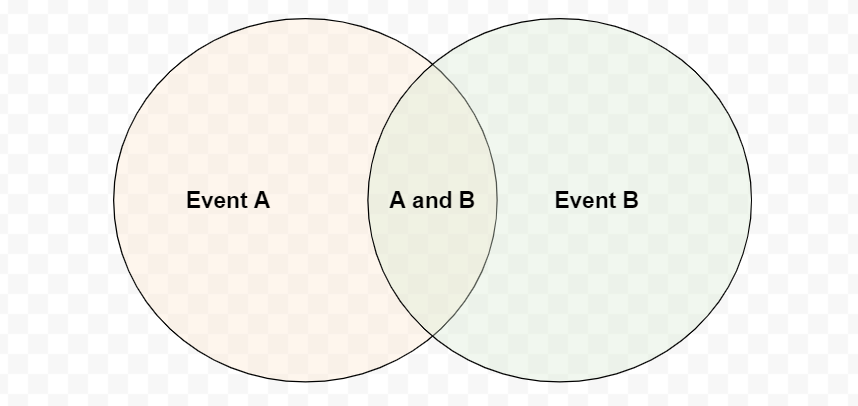
7. Finally, click the Save and Close button in the upper right-hand corner to implement all these changes and add the drawing to the Google Sheets document:
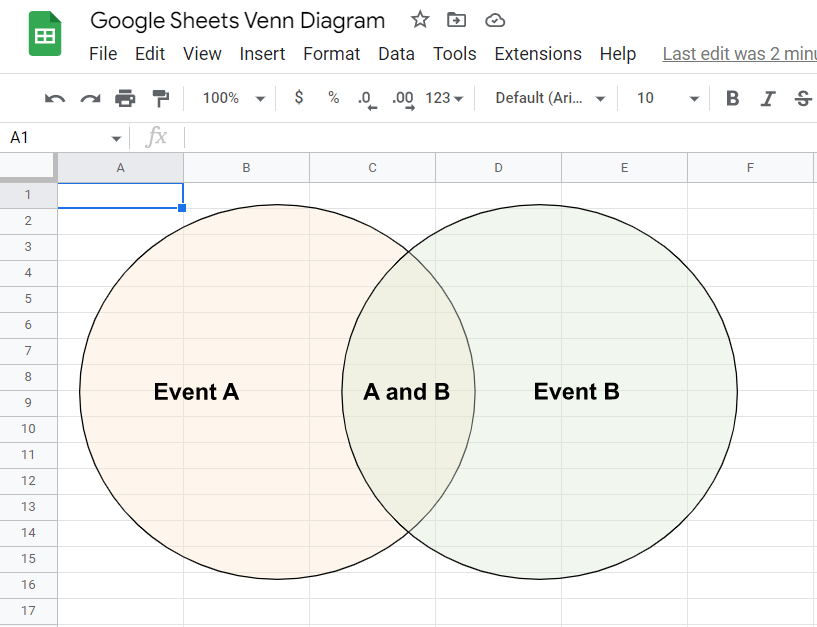
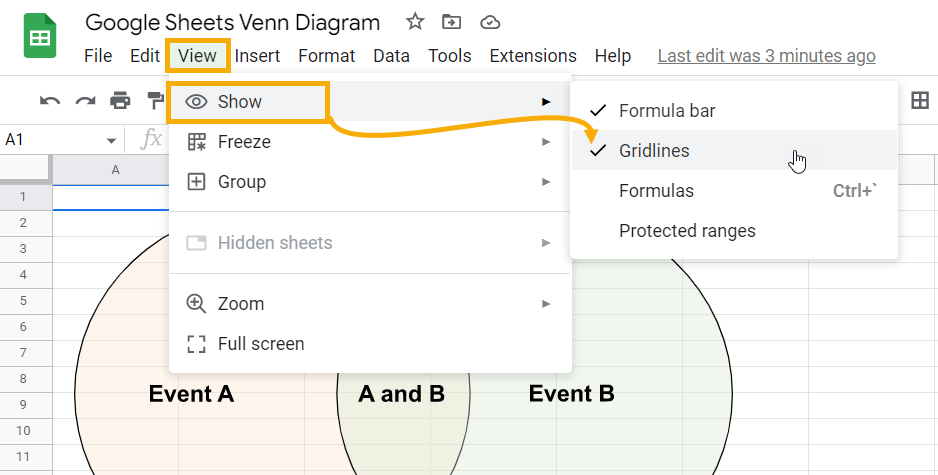
8. To make it more visually attractive, go to the View menu, select Show, and deselect Gridlines to remove the lines from the sheet so the background is blank.

Finally! Our 2-step Venn diagram is ready. At any time, you can adjust it to fit your needs, applying different text based on the situation or customizing the colors.
How to Make a 3-set, 4-set, or 5-set Venn Diagram
To create a 3-set Venn diagram, we have once again divided the entire process into two sections.
Drawing the 3-Set Venn Diagram
1. Go to the Insert menu in your Google Sheets document.
2. To insert a new drawing, click on the Drawing option in the menu.
3. In the Drawing window that appears, click the Shape icon.
4. From the list, select Shapes.
5. You will see many shapes to choose from. Pick the Oval.
6. Using your mouse, draw an Oval on the drawing board. Make sure it’s large enough to include label text.
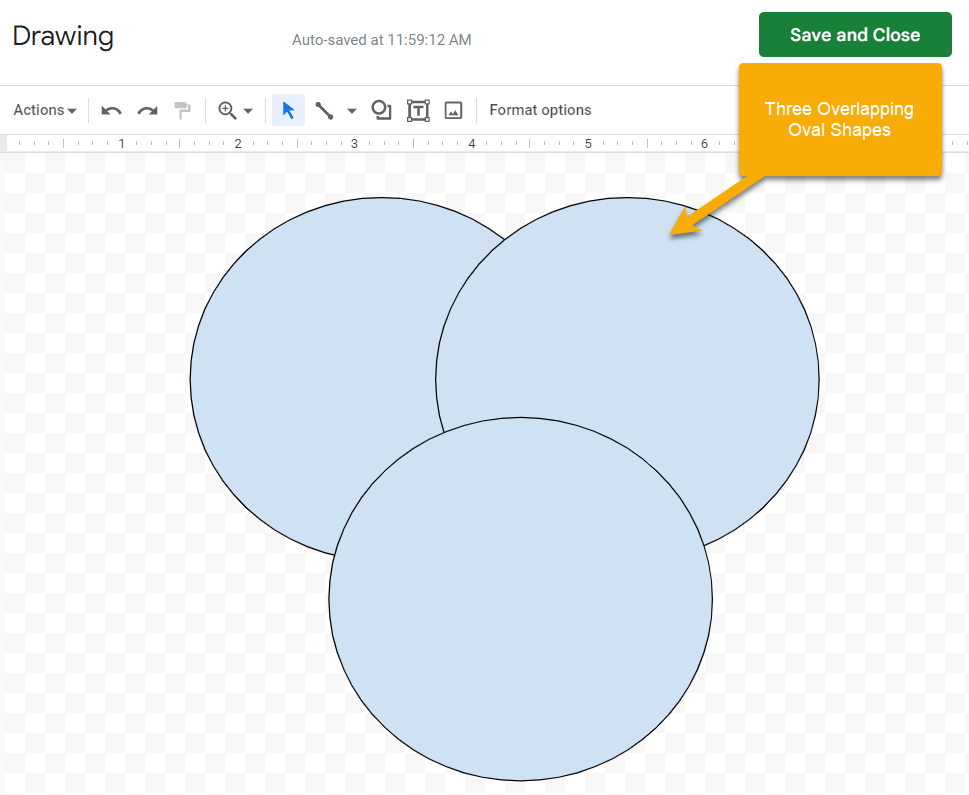
7. Open the Actions drop-down menu from the Drawing window and click on the Duplicate option (keyboard shortcut Ctrl + D). This will make a copy of the oval shape. Do this twice so you end up with three ovals.
8. Adjust the ovals so they overlap each other. This is a crucial step. Overlapping ovals form the basic shape of a Venn diagram.
Now comes the rest of the process: formatting the ovals so you can properly see the 3-set Venn diagram.
Formatting the 3-Set Venn Diagram
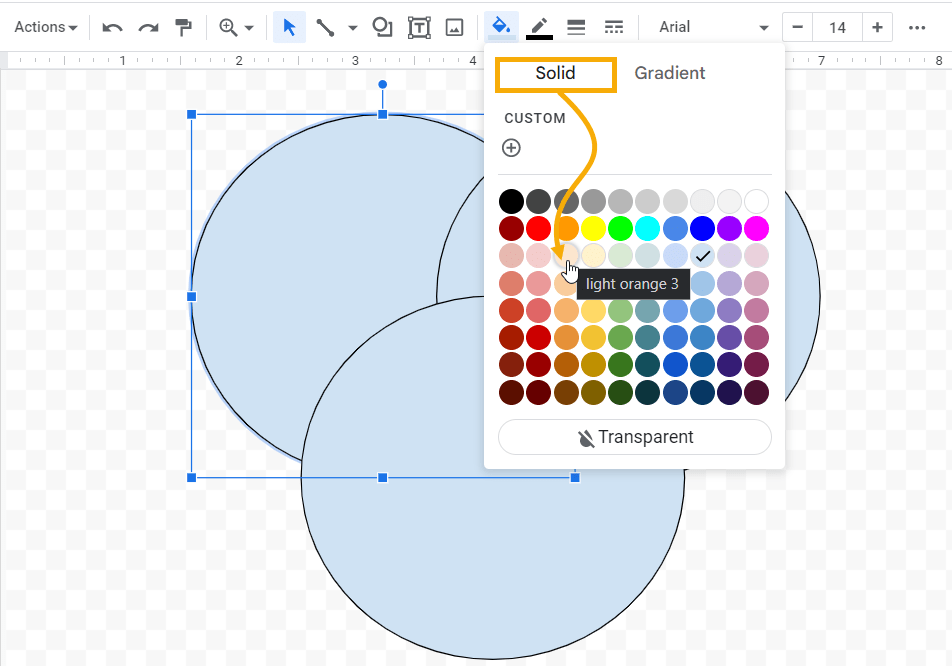
1. Select one of the ovals and click on the Fill color option at the top. Choose the light orange 3 color shade in the Solid section (or whatever color you prefer).
2. Return to the Fill color menu and choose the CUSTOM option in the Solid section. This will open a new color customization window.
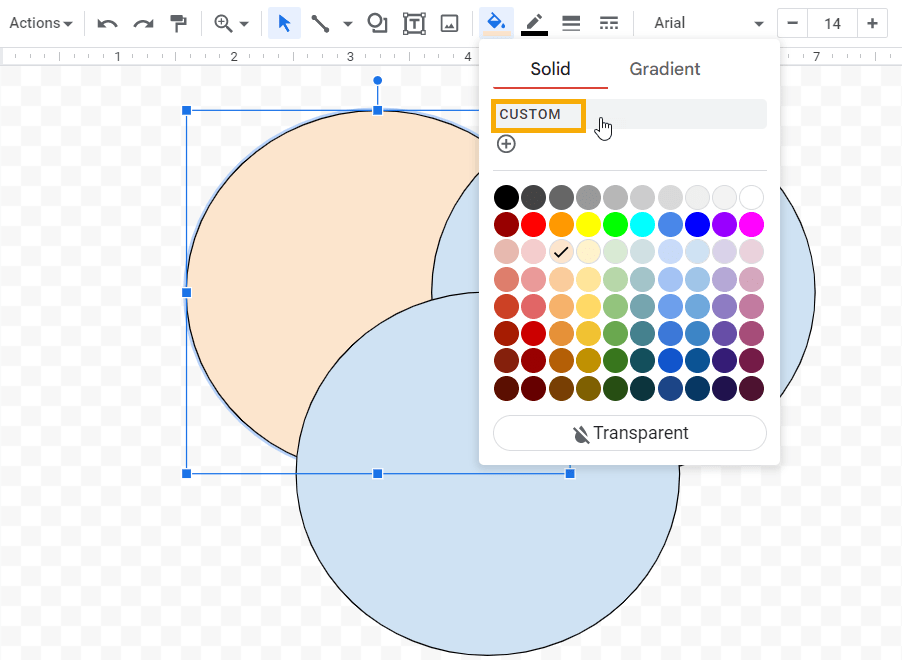
3. The TRANSPARENCY is set very low by default (not transparent). Increase it until you can see through it to the other ovals. Once done, click OK.
4. Repeat the steps for the other ovals, changing their colors to light green 3 and light red berry 3, respectively (or whatever colors you decide). Make sure you increase the TRANSPARENCY from the CUSTOM color menu.
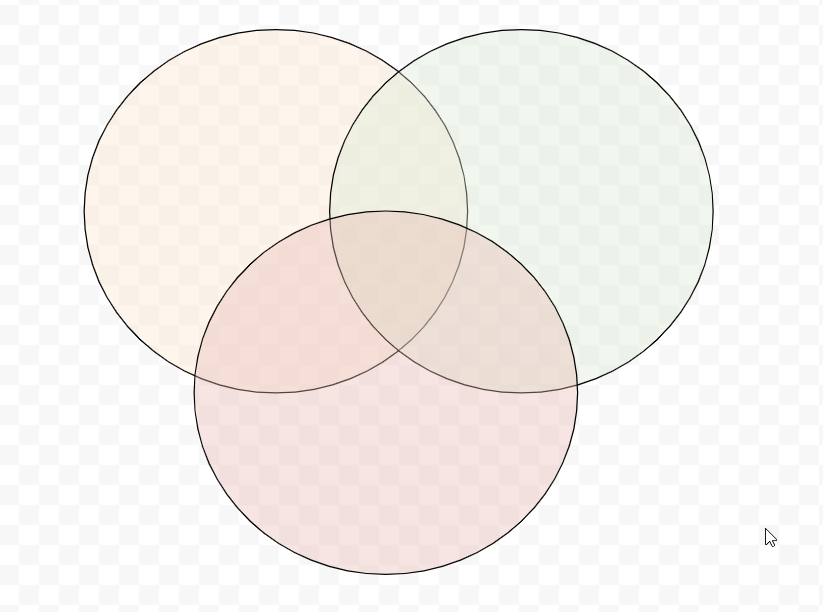
Because of the increased transparency, you can now see the common areas where the three ovals intersect.
Note: When increasing the TRANSPARENCY, be sure to set it to the same value for all the ovals so they appear uniform.
5. Now, since the three ovals have been customized, let’s insert Text boxes to label each section and intersection. Click on the Text box option next to the Shape menu in the drawing canvas.
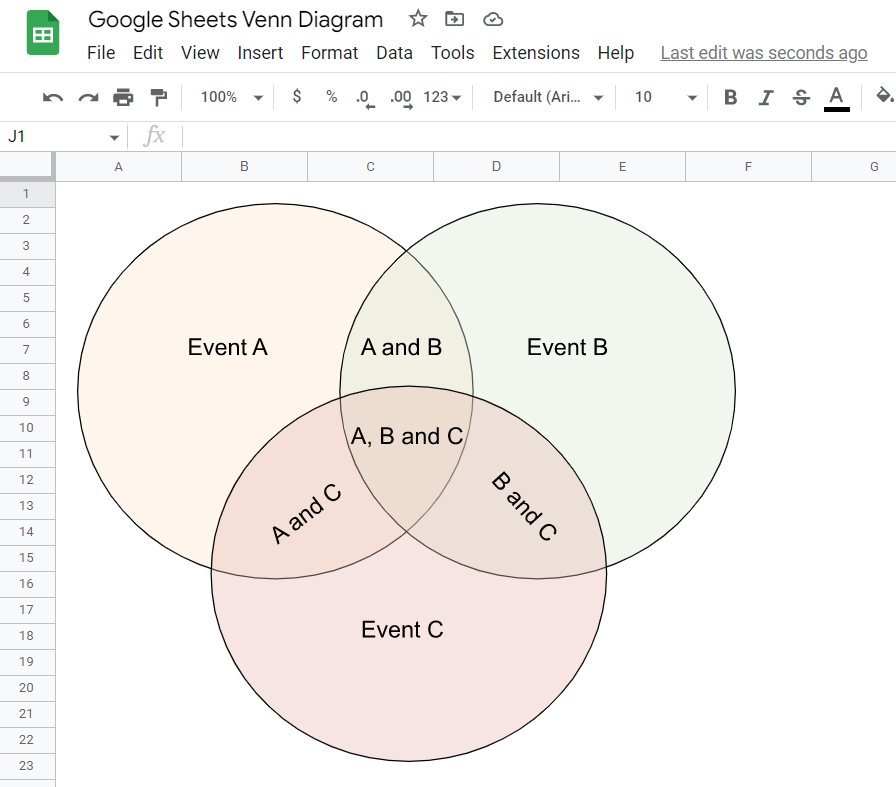
6. Draw the text boxes inside the three oval shapes and input the labels for each part of the 3-set Venn diagram. Your result should look similar to the example below:
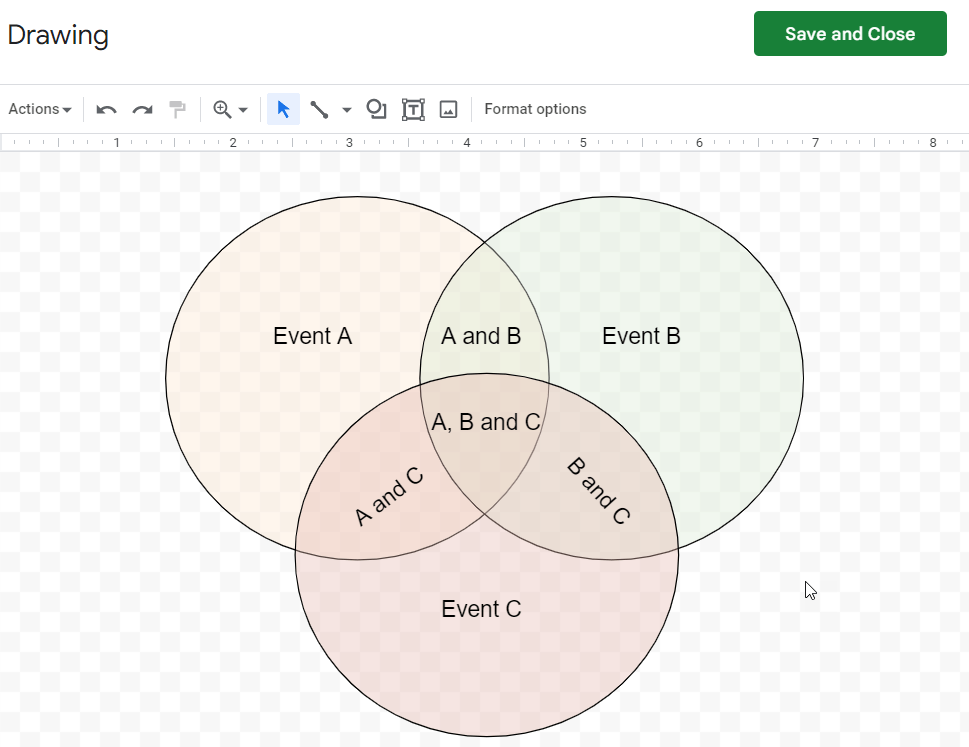 7. Finally, click the Save and Close button in the upper right-hand corner to save these changes and add the drawing to the Google Sheets document. It should look like this:
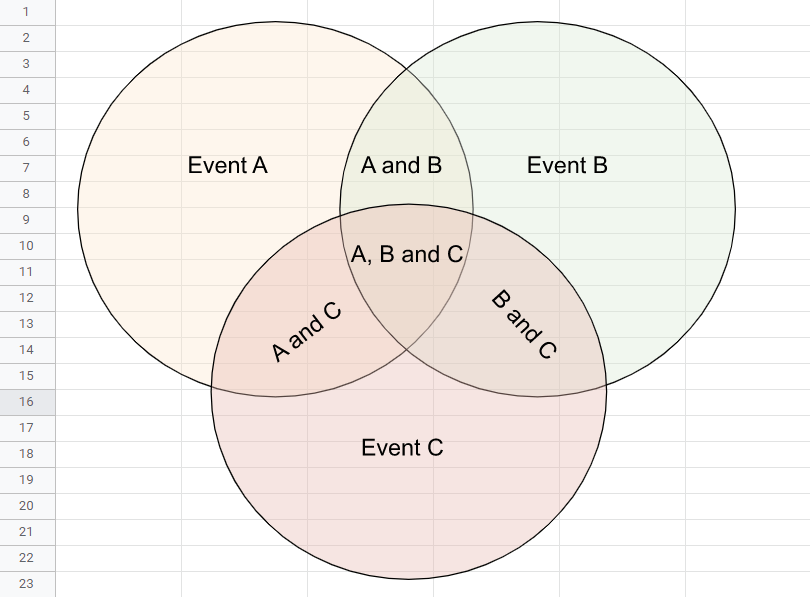
8. To make your diagram more visually attractive, go to the View menu, select Show, and deselect Gridlines to remove them from the sheet.
And just like that, our 3-step Venn diagram is ready to go. Feel free to adjust the colors or the text to fit your needs.
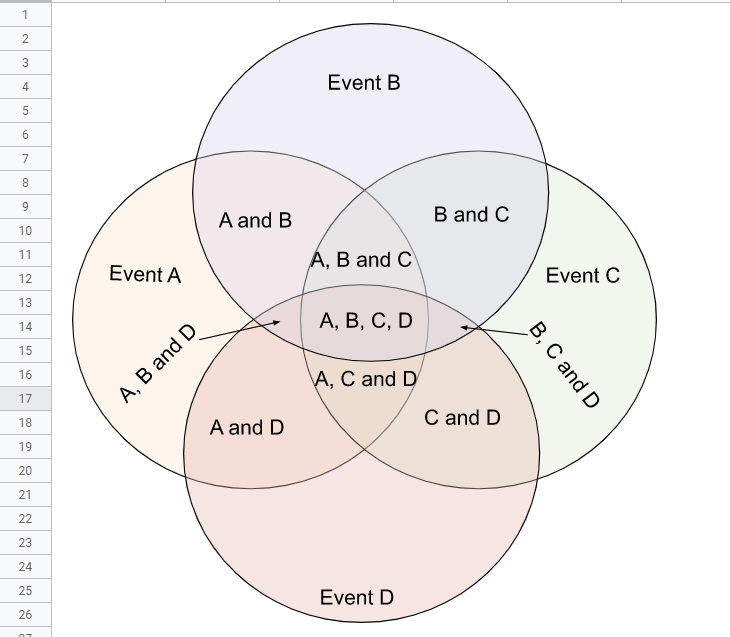
Using the same process, you can also create a 4-set and a 5-set Venn diagram.
Check out the 4-set Venn diagram example below to see how it works.
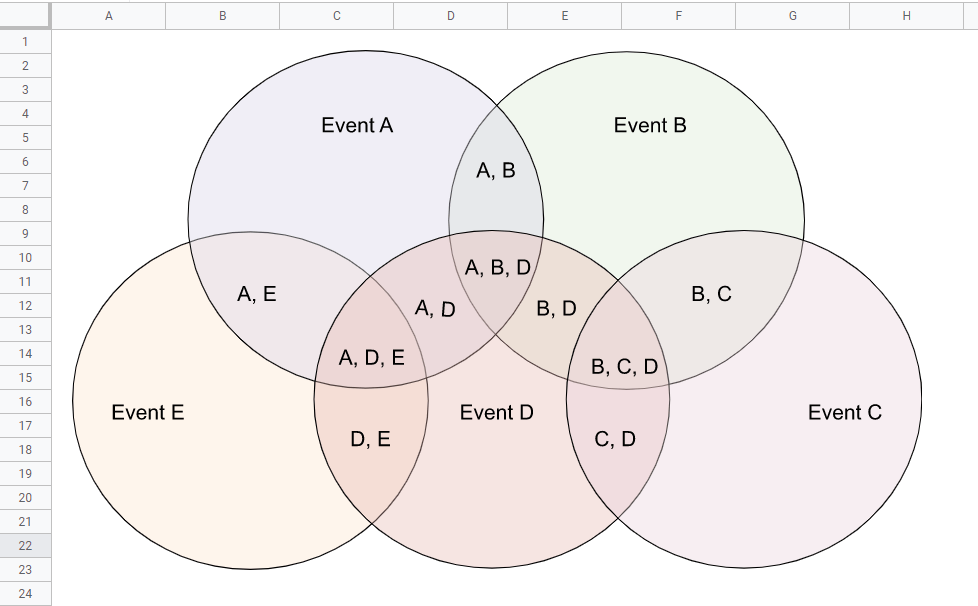
Though you may not need it all that often, here’s what a 5-set Venn diagram looks like:
Pro Tip: You can change the positions of the oval shapes in accordance with the common properties they share. In this case, there isn’t any situation where more than three events share common properties at a time. But you may come across a situation where there are more than three that share properties. This is where the 4-set or 5-set Venn diagrams can be useful.
Moreover, if you want to save time, you can access and use our free templates here (link).
